Introduction
Businesses, schools, hospitals, banks, and online platforms create vast amounts of data every day. All this information is derived from customer purchases, browsing of sites, social media interactions, medical records, financial transactions, and various other activities. But data collection is just the first step. The power is in the interpretation of the information, and what they can learn from it and apply to their decision-making. That’s where data mining comes into play. Data mining is the task of analysing a large dataset to discover useful patterns, relationships, trends, and abnormal behaviour that would not have been noticed.
For instance, a supermarket can use information about purchases to identify what products people often tend to purchase together, or a bank can analyse transactions to identify potentially fraudulent ones. Organisations can use the appropriate methods, to assist them in converting raw information into practical knowledge which they could use in making plans, solving problems and enhancing performance.

What Is Data Mining?
Data mining is the blend of various concepts from the fields of statistics, mathematics, database management, and machine learning which allows deriving meaningful information from the data. It is not just a search for information as it is trying to find a pattern that could account for the current behavior or even predict future behavior. For example, an online retailer could study a number of months of customers’ purchases to work out which products are popular, what the demand levels are for the different seasons and what customers are likely to return to the shop. Data mining can be descriptive, that is, describing patterns already evident in the data, or predictive, that is, taking historical information and trying to predict what is likely to happen.
Analysts typically establish a clear goal, gather the necessary data, remove data errors and inconsistencies, choose the data analysis methods, and assess the findings before starting a project. This process will help to ensure findings that are useful and not misleading. IBM’s data mining explanation says that the key steps for successful data mining analysis are: understanding the business problem; preparing reliable data; building appropriate models; and interpreting the output results carefully.
1. Classification: Assigning Data to Categories
Classification is a data mining technique that uses the characteristics of records to classify them into predefined categories. It’s especially helpful when an organization is familiar with the categories they wish to predict, and has historical examples that can be used to teach the model the distinctions between the categories. For instance, an email service could use relevant information to classify incoming e-mail as spam or legitimate, a bank could use pertinent financial data to categorize loan applications as risk classes. The data that is used to build a classification model includes historical data with the data itself and the correct category.
The model learns the relationship between the inputs and the labels, and then uses the learned relationships to predict the labels of new inputs. Popular classification techniques are decision trees, naive Bayes, k-nearest neighbours, support vector machines and random forests. The algorithms tackle the problem in different ways; the most suitable one will vary depending on the data, the complexity of the task and the need for explainability. Classification has proven to be useful in customer service, fraud detection, medical research, and document organization, however, if the classification is misused, its effects can be severe and can have long lasting consequences.
How Classification Works in Practice
Suppose you have an online store and you want to know who the customers are that will be interested in an email marketing campaign. The business can review previous records of customer purchasing history, email communication and previous responses to promotions. A classification model can be trained to identify the combination of these attributes that are correlated with a positive response. If a new campaign is being considered, the model can be used to determine which customers are more likely to be interested in it, and thus determine how to structure the marketing campaign. But when you make a prediction, you can’t be certain that the customer will respond, and what has happened in the past could be different in the future.
The model should be tested with data different from that used in its training and its performance should be evaluated using suitable performance measures, including precision, recall and accuracy. When positive results are hard to get, accuracy can be misleading. For instance, a model that flags nearly all messages as legitimate might have high accuracy but be missing a lot of spam messages. Different measures can be used to evaluate the performance of classification, giving a more comprehensive view of it.
2. Clustering: Finding Similar Groups
Clustering is a type of data mining that is used to cluster similar records together without having to have pre-defined category labels. Clustering is used to find natural groupings that can be used to classify records, whereas classification is used to learn to classify records. This is particularly important for exploratory analysis, which seeks to understand how the data is organised without making any predictions. Retailers, for instance, could cluster customers based on their buying behaviors, payment habits and whether they prefer a specific product category. These groupings could identify regular customers, occasional customers and those that mainly buy lower-priced items.
The common clustering methods are k-Means, hierarchical clustering and DBSCAN. The difference between the two is that k-means segments are recorded into a number of predefined clusters, while hierarchical clustering creates a hierarchy of nested clusters. DBSCAN finds dense regions of similar records and can be used to find irregularly shaped clusters. Each method is applicable to different kinds of data, depending on its size, shape, and content. Clustering may be used in customer segmentation, document organization, market research and analyzing complex data sets.

A Case Study of Clustering Application
Let’s use an example from the telecom industry: a telco that needs to know more about their subscribers’ mobile service usage. It could gather details such as monthly data usage, call frequency, duration, and service preferences. The company can use the clustering to find clusters of subscribers who have similar service usage. The first group could be customers who consume mostly mobile data, and the other group could be customers that make a lot of calls with little internet data. Another group could consist of customers who are using multiple services on a regular basis. These revelations can help the company formulate appropriate service packages and communicate with customers on these packages.
But it does not necessarily mean that the grouping is of commercial significance or that the grouping exists for any reason. The characteristics of each cluster must be analyzed and the question asked: Do the findings meet the original objective? They should also think about how many clusters they chose and how the outcome is not very different (reasonably stable) if there is some change in the data. The process includes interpretation; a mathematically distinct segment might not be a useful business segment.
3. Regression: Predicting Numerical Values
Regression is a data mining technique that estimates numerical values, based on the examination of relationships between variables. This is helpful if the output is a quantity and not a category. Regression can be used in business for predicting sales revenue, estimating product demand, analysing delivery times or exploring the relationship between advertising costs and sales performance. For instance, a retail store could review past sales data, product prices, advertising campaigns and trends to predict sales and revenue. Linear regression is one of the most popular first steps, since it is used to model a relationship between one outcome variable and one or more input variables.
There are other techniques, such as polynomial regression, ridge regression, lasso regression, and decision tree regression. The pros and cons, the assumption and the limitations vary with each method. Using regression models, organisations can gain insight into variables that are related to variation in an outcome, but regression does not establish a causal relationship between variables. To make reliable predictions, it is necessary to use the right data, the right features and test predictions against data that is not part of the model-building process.
Regression in Sales Forecasting
If a small business is thinking about buying some inventory, what it really wants to do is make an estimate of its monthly sales revenues. They might look at past sales data and price, promotions, holiday and seasonal demand data. All of these variables can be used in a regression model to predict the revenue for a future month. The estimate can then be used by the business for budgeting, purchasing and staffing purposes. When the model consistently underestimates demand during the holiday season, the company should consider adding more specific seasonal data or determine if the company’s training data is representative of the holiday season.
Measures like mean absolute error, mean squared error and root mean squared error can be used by analysts to assess regression models. These are metrics that show the discrepancies between the predicted and the observed values, but each focus on errors in different ways. Regression is particularly helpful when numerical estimates can be used to assist planning, but the results should not be used as a certainty. Past data can only predict some future events, but not all; customer behaviour is constantly evolving, as is the availability of supplies, and there are also new competitors.
4. Association Rule Mining: Finding Relationships Between Items
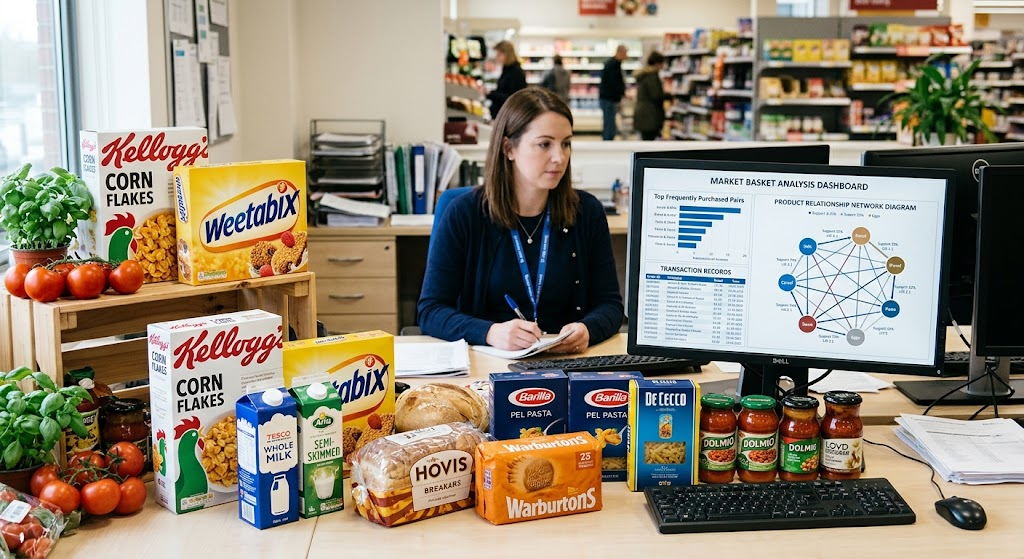
Association rule mining is used to discover frequent co-occurrence of attributes or events in a data set. It is very useful in retail, online shopping, recommendation systems and customer purchasing analysis as it can show relationships that are not easily identified when looking at individual transactions. A store selling flour and macaroni, for instance, may find that people who buy pasta also buy pasta sauce while they are shopping at the store. This information can be utilised by the business to enhance product placement and tailor promotions, or to recommend complementary products to customers.
There are two popular algorithms that are used for association rule mining: Apriori and FP-Growth. Apriori finds frequent combinations of items and produces rules based on them, whereas FP-Growth finds frequent patterns without producing as many candidate combinations using a compact data structure. Support, confidence and lift are three metrics that are often used for assessing association rules. Support is the frequency of the occurrence of a combination of items and confidence is the frequency of the occurrence of the consequent when the preceding item is true, while lift quantifies the strength of the association between the items compared to the strength of the association between them if they were independent.
Association Rules: Example With Explanation
Suppose a web supermarket gathers thousands of completed orders and discovers that people who buy breakfast cereal tend to buy milk at the same time as they buy the cereal.Suppose a web grocery shop compiles thousands of completed orders and finds out that people who buy breakfast cereal also tend to buy milk at the same time as the cereal. This can be captured in the store by a rule: People that purchase cereal also tend to purchase milk. If the rule is common in the business and has a greater chance of customers purchasing milk than the general chance of them purchasing cereal, the business may choose to place the products side by side or encourage the customer to buy milk if they are looking at cereal.
But the connection does not imply that customers are going to buy milk when they buy cereal. Both products may be something that is needed in the home. Analysts also need to make sure that not all statistically common associations are useful. Some rules could be in plain sight while others could be present due to popular products being present in many transactions in the dataset. Knowing or feeling how well a support, confidence or lift is affecting a business and how relevant it is to the business can help to distinguish meaningful from unhelpful patterns. Association rule mining is best suited to finding co-occurring items or events, not predicting a continuous value or assigning a record to a predetermined category.
5. Anomaly Detection: Detecting Unusual Activities
Anomaly detection is the task of determining whether an observation is significantly different from its expected pattern or not. These observations can be a sign of error, abnormal behavior, technical issues or even fraudulent activity. While classification typically relies on examples of known classes, anomaly detection can identify suspicious cases when examples of all classes of problems are not available. For example, certain payment providers might consider transaction amounts, locations, timings, and transaction histories to detect activities that are outside the typical customer conduct.
For manufacturing companies, it is possible to check the readings of the equipment and get an alert if there is any unequal rise in temperature or vibration pattern, which could mean a developing fault. These techniques include statistical outlier detection, isolation forests, clustering-based techniques, and one-class support vector machines. This will rely on the nature of the data and what type of anomalies are expected. One of the biggest issues is that not all unusual equals bad. If a customer is purchasing a significant amount for the first time, he/she may be acting in good faith and this should not be an automatic indicator of an anomaly.
Tackling Fraud and Anomaly Detection
Anomaly detection can be applied to financial institutions to flag transactions that are suspicious and require investigation. A model could indicate an unusually large payment transaction, an irregular series of payments, or unusual activity on an account that is significantly different from previous activity. These alerts may be a way to prioritize cases and quickly address potential threats. But fraudulent transactions have a tendency to look like a legitimate transaction, and a legitimate transaction can look suspicious for valid reasons. A well designed system should therefore be a compromise between missed detections and false alarms.
Customers might be subjected to unneeded interruptions and investigators might be overwhelmed if too many legitimate payments are flagged as suspicious. If it fails to detect enough suspicious transactions, the losses could escalate. Anomaly detection can be complemented by other evidence, other classification models, by transaction rules and human review to boost organisations’ performance. They should also be aware of fraud pattern shifts as the fraudsters’ tactics can change over time. Anomaly detection, by itself, is useful not because it is able to detect all problems automatically, but because it can be used to guide organizations to look at observations that might need further investigation.
6. Sequential Pattern Mining: Finding Patterns Over Time
Sequential pattern mining aims to discover the patterns that are regular sequences of events appearing in a specific sequence. Association rule mining is about relations among items, and sequential pattern mining is about the sequence in which activities happen. The distinction is significant because two customers can do the same thing, but take different paths to a purchase or other result. For instance, an online retailer may find that users are often viewing a product, reading the reviews, adding the product to their cart and then purchasing it.
This sequence can help in the site navigation and pinpoint areas where customers drop off the buying journey. Other examples of sequential pattern mining are: customer journeys, equipment maintenance records, website navigation, and repeated services interactions. GSP and PrefixSpan are algorithms for finding frequent sequences in event data. In the context of learning about this technique, beginners can explore the concept of sequential pattern mining, which will familiarise them with how sequential events are analysed and how sequences can be used to uncover valuable behavioural patterns.
An Illustration of Sequential Pattern Mining for a Business
Think of an online learning platform that logs the interactions that students have with its courses. The analyst can see that many successful learners start with an introduction to a topic, do a practice exercise, get feedback and then go onto a more complex topic. This pattern may be useful for informing the platform’s understanding of typical learning trajectories and enhancement of the structure of its learning resources. A retailer could also apply the same approach to determine the order of product searches, product views, and purchases that often leads to a completed order. These findings can help provide improved recommendations and easier customer experience.
However, there are some limitations that should be noted: Sequence patterns should be used in context. Not every sequence observed is necessarily a causal sequence and different users might have different paths to the same end state. Analysts also need to establish appropriate time periods and identify appropriate events to consider in the investigation. If the order of the activities has important information that would be lost if the events were analysed as an unordered collection, then the sequential pattern mining is more useful.

7. Text Mining: Extracting Insights From Text
Text mining is the process of analyzing text to discover patterns, topics, relationships and trends. Textual data comes from customer reviews, customer support, emails, surveys, reports, and even social media conversations, and it’s a tremendous volume. When the information is distributed among thousands of documents, manually reading them can be challenging. Organisations can make sense of this content in an organised manner and identify themes that can assist them in making better decisions with text mining. Typical applications are keyword extraction, document categorization, topic modeling, sentiment analysis, and named entity recognition.
For instance, an online company might examine their product reviews and notice that a lot of people are commenting on the delivery, quality, costs or client service. Inbound messages might be categorized as payment issues, account access, product inquiries, and more. These tasks can be aided by the use of tools and libraries like the Natural Language Processing packages in Python. But text is often contextually ambiguous, informal. Automated analysis may not always be accurate, due to the use of sarcasm, spelling errors, slang or variations in language, and should be verified prior to making any major decisions.
Text Mining in Customer Feedback Analysis
Suppose that a company offers a new product and it gets thousands of customer reviews. The average rating offers quick insight, but not insight into what customers like and dislike about the product. Some of the topics that appear frequently and some of the comments can be classified by using text mining based on their general sentiment. A customer may say the design is great, but constantly complain about the battery life or delivery packaging, for instance. Management can take these results to help them determine where to look for additional information and focus their efforts to make improvements.
Sentiment analysis can determine if the comments are positive, negative or neutral and topic modelling can identify common themes without needing to predefine the topics. However, not all negative comments are a sign of general dissatisfaction, and a positive sentence can contain a criticism that is not picked up by a simple model. In such cases, or when the feedback is complex or the decision has a lot of consequences, companies should use automated text analysis along with representative human review. The best use of text mining is to make large volumes of written information understandable and usable as evidence that enhances the customer journey.
Choosing the Right Data Mining Technique
The first step to choosing a data mining technique is to determine what question needs to be answered. When forecasting a pre-specified class, classification is typically a good place to begin. When the aim is to predict a numeric result, regression might be the better method. Clustering can be helpful when analysts wish to find groups that they do not know about before the data analysis, and association rule mining can be helpful for finding items that often occur. The choice between anomaly detection, sequential pattern mining and text mining depends on the nature of the task: Anomaly detection for detecting unusual observations; Sequential pattern mining for detecting patterns of events occurring in a sequence; Text mining for extracting knowledge from textual information.
Also the available data has an impact on the decision. Analysts need to determine if the data is structured or unstructured, if the outcomes from past actions are available, the amount of information gathered, and if there are missing or unreliable values within the dataset. They also need to take into account the time and computational resources that are available, the need to communicate the results to decision makers, and the implications of wrong predictions. In many projects, two or more techniques can be more beneficial than one technique alone.
Questions to Ask Before Choosing a Method
Organisations should first decide on a set of criteria or definition of success for the data mining model they build and how they will measure success. The task should be broken down to see if it is a prediction, discovery, monitoring or explanation task and decide which information is actually relevant to the task. Data preparation is especially crucial as duplicated data, inconsistent formats, missing data, and inaccurate labels can have a negative impact on analysis. However, when testing predictive modelling, analysts need to ensure that data is split accordingly, so that data from the future does not accidentally affect predictions of the past.
The type of evaluation needs to be consistent with the nature of the practical problem: classification may have to be measured in terms of precision and recall, regression in terms of error measures, and clustering in terms of measures of group separation and human interpretation. In dealing with association rules and sequential patterns, analysts should check the meaningfulness, frequency, and usefulness of these patterns. Lastly, companies should take into account privacy, security, fairness and the fact that a model may vary its performance as conditions change. These checks play a role in achieving the transformation of technical results to reliable evidence for decision-making.
Real-World Applications of Data Mining
There are various data mining techniques used in a variety of activities in different industry segments. In retail, clustering is used to segment the customer groups, association rules find the products which customers often buy together, and regression is used to forecast the demand. Classification and anomaly detection can be used by financial institutions to prioritize potentially fraudulent transactions, evaluate chosen risks and track unusual account activity. Depending on the type of medical data, researchers can use the data to investigate patterns that can be linked to certain outcomes or outcomes in general, but only under the supervision of a professional and with careful validation.
Manufacturers can access equipment information for irregularities and use regression to predict maintenance needs or production results. Learning activity can be analysed to gain insights into patterns of engagement and where further support may be needed from educators. The information gained from analysing feedback through text mining and users’ navigation through services via sequential pattern mining can be used on online platforms. Each technique should relate to the question, the data should be treated appropriately and the results should be examined before they can be used to inform decisions. Data mining offers helpful evidence but it also does not eradicate the necessity of human judgment and knowledge of the industry being studied.
Benefits and Limitations of Data Mining
A primary advantage of data mining is having the ability to find patterns that might not be obvious by looking at the data manually. These findings can help organisations to gain insights into customer behaviour, optimise their operations, detect unusual activity patterns, allocate resources, and make informed decisions. In addition to this, data mining can enable businesses to test their assumptions in light of historical evidence and not solely by intuition. But it is only effective if the data it is based upon is good and relevant. The lack of records, the presence of outdated information, biased samples and incorrect labels can lead to misleading results.
Others are not easily explained, and it can be hard to understand why a specific prediction was created. Another significant factor is privacy, especially if the data sets include personally identifiable, financial, educational, or medical information. Information should be gathered and utilized responsibly by organisations, access to information restricted where appropriate, and organisations should abide by data protection requirements. They should also be aware that patterns can be different in the future and statistical relationships do not imply causation. Technical evaluation, clear objectives, safeguards, and monitoring are required for responsible data mining.
Conclusion
Understanding the major data mining techniques gives beginners a strong foundation for exploring how information can support better decisions. Classification predicts predefined categories, clustering discovers natural groups, regression estimates numerical outcomes, and association rule mining identifies items that frequently occur together. Anomaly detection highlights unusual observations, sequential pattern mining reveals recurring event orders, and text mining extracts insights from written information. Each technique addresses a different analytical problem, and choosing the right one depends on the objective, the available data, and the consequences of the results.
Businesses can combine these methods to understand customers, forecast sales, prevent fraud, improve services, and investigate operational challenges. However, useful analysis requires more than selecting an algorithm. Analysts must prepare reliable data, evaluate model performance, interpret findings carefully, and consider privacy and fairness. For beginners, the best approach is to start with a clear question, learn the basic principles of each technique, and practise using small, understandable datasets. With consistent practice, data mining becomes a practical way to transform raw information into meaningful insights.