Introduction
Database monitoring tools allow database administrators (DBA) to effectively maintain databases within businesses. As many processes in organisations now involve digital services, ensuring databases perform efficiently and reliably is very important. Slow databases can cause long loading times within applications, disruptions in business operations, and poor user experiences. To ensure efficient database performance, DBAs should have reliable tools that allow them to understand the activity in databases, detect performance issues, and prevent unexpected disruptions. Database Monitoring Tools allow DBAs to gather performance data from databases to better understand operations within databases, investigate anomalies, and make informed updates to improve performance.
Database monitoring tools can be used to monitor various performance indicators within databases, including query time, CPU and memory usage, storage capacity, concurrent connections, and server availability. Data collected will be displayed to DBA’s in monitoring dashboards, reports or alerts, so that they can understand the behaviours of databases within the environment. If DBAs have monitoring tools, they can detect any early signs of potential issues within databases before users experience any issues. Some monitoring tools are specific to certain databases, whilst others can monitor multiple types of databases for Cloud, On-premise and hybrid environments. Understanding the tools available, what capabilities they have, and their limits, will allow organisations to choose suitable tools to match their technical requirements and requirements.
What are Database Monitoring Tools?
Database monitoring tools allow for monitoring of databases to understand how well they are performing. Data can be gathered from database servers, OS and connections from applications to provide DBA’s with an understanding of database performance. Issues such as slow query times, high resource usage, connection errors, storage issues and unexpected activity in the database can be identified. Depending on the tool used, data can be gathered from databases continuously, periodically or via specific tools/ interfaces within databases. Once data has been gathered it is displayed in dashboards, charts, alerts and reports to help DBA’s better understand complex database operations without having to manually check each operation within the database.
Database monitoring tools can help DBAs work proactively. Performance trends can be identified to allow DBAs to understand what normal performance looks like within systems. If the database usually performs a certain volume of transactions within business hours but experiences unexpected increases in response time or resource usage, there may be an emerging issue. Tools can highlight this and alert DBAs if certain thresholds have been exceeded. More advanced tools can perform query analysis, compare previous performance, highlight anomalies, and provide troubleshooting recommendations. Whilst DBA’s cannot be replaced by database monitoring tools, they do provide valuable information which can be used by DBAs to troubleshoot, optimize workloads, maintain availability, and plan improvements to infrastructure.
Why database monitoring should be performed
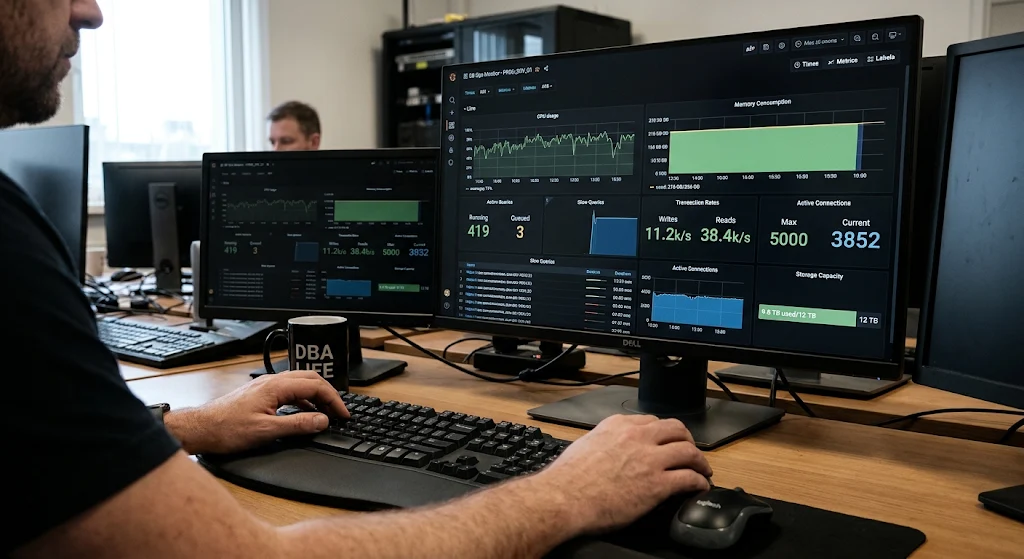
Database performance impacts application and service reliability. If databases are performing poorly, applications may be unable to quickly retrieve information, transactions may take longer to finish, or users may experience interruption. By monitoring databases, DBA’s can identify any issues in performance before impacting business processes significantly. Increases in CPU usage may mean that inefficient queries or heavy workloads are occurring within the database, and decreases in storage capacity may indicate database files are reaching capacity limits. Identifying these early means that corrective action can be taken to address issues before causing disruption within systems.
Improved resource management can be achieved by performing database monitoring. As organisations grow, increase new applications and store more information, DBAs may encounter increased workloads in databases. If database performance data has not been monitored in the past, it can be difficult to determine if current infrastructure will be able to support increased demands. Performance trends within databases provided by monitoring tools allows DBAs to understand resource usage within databases, identify regular performance bottlenecking issues, and understand the impact of changes made to database configurations. Additionally, improved visibility can be given to DBA’s, developers and IT staff. This makes troubleshooting easier, allows more informed decisions to be made around infrastructure and improves reliability across different types of databases.
Top 10 Database Monitoring Tools
There are many database monitoring tools available to allow DBA’s to ensure databases are running efficiently. Each tool has different capabilities, and different DB technologies are supported.
Different requirements are required to deploy the tools, and the cost varies between tools. Some can include detailed query analysis, whilst others include infrastructure monitoring, DBA interfaces, and custom dashboards. Below are 10 tools which allow database performance to be monitored in different ways.
1. SolarWinds Database Performance Analyzer
SolarWinds Database Performance Analyzer (DPA) allows DBAs to detect, investigate and fix performance issues in databases. The tool works with many databases including Microsoft SQL Server, Oracle, PostgreSQL and MySQL. The tool includes wait time analysis. Wait time analysis shows how much time operations in the database were waiting for resources or other operations to complete. Due to this, DBA’s can understand how much impact database delays are having on application performance. This allows DBAs to easily detect whether performance issues are caused by inefficient queries, resource contention, blocking sessions or other issues.
This tool can also give historical performance data, and includes query analysis and diagnostic tools to allow proactive troubleshooting. Inefficient SQL statements can be viewed, wait time events investigated and performance trends viewed to understand when issues in databases may be occurring. Anomalies in database performance can be detected, and alerts sent to DBAs if critical performance criteria is exceeded. This makes SolarWinds DPA a great choice for companies with critical databases, as it allows detailed performance analysis. However, before choosing this as the main monitoring tool to use, consideration should be given to licensing requirements, database versions supported, and the cost of deployment.
2. Datadog Database Monitoring
As part of the Datadog observability suite, Datadog Database Monitoring allows DBAs to monitor the performance of databases within different infrastructures. The tool works with many databases including PostgreSQL, MySQL, Microsoft SQL Server, Oracle, MongoDB and other supported databases. With this tool, DBA’s can monitor query performance, activity in databases, resource usage in hosts, and historical performance data. Combining database data with infrastructure monitoring means that DBAs can understand how server conditions, and application activity may be affecting database performance. This makes it useful for companies who have distributed applications or monitor databases across multiple cloud/on premise environments.
One key feature of this tool is query monitoring. Expensive SQL queries, slow queries, and changes in performance can be identified. DBAs can view metrics related to query performance, sample queries, and query execution plans. If certain queries are consuming a large amount of resources DBA’s can understand why. Custom dashboards, recommendations and alerts can be set up so that teams are alerted if database performance differs from expected. This makes the tool useful to organisations looking to integrate database monitoring with application & infrastructure monitoring. However, considering the pricing and data collection requirements in large environments is important.

3. Prometheus
Prometheus is an open source monitoring and alerting tool, frequently used to monitor time series data from applications, servers & infrastructure. Although not specifically a database administration tool, database environments can be monitored with Prometheus by using exporters. Performance data can be captured from databases depending on the exporter used, including availability, concurrent connections, query activity, transaction rate, CPU usage and memory usage. Data is captured periodically depending on configurations, and stored as time series data. This allows DBAs to identify changing performance over different time periods, and see any unusual patterns.
Flexibility in querying and alerting is another key feature in Prometheus. DBAs can run queries on metrics using the PromQL language. Monitoring rules can also be set, and alerts created if certain conditions in the data should be addressed. For example, if a database is experiencing an unexpectedly high number of connections or decreasing availability, alerts can be set up. Prometheus can check if these conditions are met, and work with the Alert Manager tool to collate and send out alerts. As this is open source, and is very flexible in integration, it is suitable for organisations wanting very customised monitoring systems. However, additional exporters will generally be required for database monitoring, and DBA’s will need to know what metrics specific database platforms will provide.
4. Grafana
Grafana is an open source analytics tool, allowing DBAs to visualise monitoring data. Data can be pulled from various sources including Prometheus and information displayed using charts, tables and other visuals. Within database administration, Grafana can allow DBAs to easily view key metrics in databases. These include CPU usage, memory usage, query activity, concurrent connections, transaction rate and storage. Custom dashboards allow teams to display database data in a way best suited to their needs. Separate dashboards can be made for individual database servers, application environments or whole infrastructures.
Alerts can also be created within dashboards. If certain metrics reach certain conditions, DBAs can be alerted. For example, if a dashboard is displaying database response times and server resource usage, it can be identified if performance issues are caused by high workloads or infrastructure limitations. If Grafana is combined with Prometheus and a suitable database exporter, it is a flexible option for monitoring many different types of databases. However, as Grafana is only a visualisation and analysis tool for data coming from data sources, for accurate database data, appropriate data sources and monitoring integration should be set up. Therefore, organisations must carefully configure data sources and monitor integration for accurate data.
5. Percona Monitoring and Management (PMM)
Percona Monitoring and Management (PMM) is an open-source tool to monitor and manage database performance for supported databases. It can be used with MySQL, PostgreSQL, MongoDB and other databases included in current integrations. The tool captures performance metrics for databases and infrastructure, and displays this in dashboards. Key areas of performance being monitored include CPU usage, memory usage, disk I/O, network activity, database connections, replication and query behaviour. As the data can be viewed from a central location, PMM is useful for organisations managing multiple databases in on premise, cloud or hybrid environments.
A key feature of PMM is query analysis. This allows DBAs to identify which queries are causing high workloads in databases. DBAs can view query performance, analyse query execution plans, and compare activity across multiple database instances. Alerts can be raised if certain metrics in the database go above set thresholds. Advisories are also included in PMM to highlight potential issues in a database’s configuration, security or performance. This provides DBAs with valuable information for proactive management. As this is open source with detailed database specific insights, PMM is appealing for organisations. However, consideration should be given to which integrations PMM supports, infrastructure requirements and configuration in order to decide if PMM is suitable for deployment in production environments.
6. pgAdmin
pgAdmin is a popular open source tool for administration and management of PostgreSQL databases. Whilst this tool primarily focuses on database administration, it does include some useful monitoring features. In the dashboard, database and server information can be viewed. This includes active connections, transactions per second, records added/retrieved and block I/O. Information about sessions in the database, logs in databases and queries which may be impacting performance can also be viewed. This provides useful insight to DBA’s without requiring another monitoring dashboard for basic PostgreSQL database administration.
Under the Activity and Statistics tab, DBA’s can understand more about connection and transaction activity in databases. Under the session data, DBAs can see active and inactive connections. Transaction statistics allow DBAs to understand activity in databases. If issues are encountered in database performance, locks and session details can be analysed. Graphical representations can be produced for selected performance metrics, meaning changes over time can be easily viewed. As this is focused primarily on PostgreSQL, pgAdmin is ideal for individuals or organisations working mainly with PostgreSQL to have an easy to access administration tool. If advanced monitoring across different platforms, lots of alerts, or consolidated reporting across large database environments is required, additional monitoring tools may be required.
7. MySQL Enterprise Monitor
MySQL Enterprise Monitor is a monitoring tool for organisations with MySQL databases. It allows DBA’s to monitor server health, troubleshoot performance issues and identify conditions which may cause issues with reliability. This tool allows DBA’s to understand how MySQL servers are performing under application workloads by viewing performance, resource usage and operations. Performance issues such as inefficient queries, high resource usage, connection activity and other performance issues in databases can be identified. This is important for organisations relying on MySQL to support websites, business applications, customer platforms and transaction processing systems.
One key feature of this tool is query analysis. DBAs can identify queries in databases consuming high resources. By analysing query performance in databases, DBAs can identify improvements to be made in indexing, or SQL queries to optimise inefficient queries. Rules can also be set up in monitoring, and alerts sent to DBAs to understand significant conditions in databases. As this tool focuses on monitoring MySQL databases, it is ideal for organisations wishing to have monitoring tailored to MySQL. However, this tool is primarily for monitoring MySQL databases. If an organisation manages several different types of databases, additional tools may be required to monitor multiple databases in a central location.
8. Microsoft SQL Server Management Studio (SSMS)
Microsoft SQL Server Management Studio (SSMS) is a tool to configure, manage, query and manage Microsoft SQL Server databases. Although this is not a full enterprise monitoring tool, it does include many features to allow DBAs to understand performance issues. A useful feature within SSMS is the ‘Activity Monitor’. This allows DBA’s to view processes in SQL Server, wait time for resources, disk I/O and expensive queries. This can allow DBA’s to understand what is occurring in the database instance, and identify processes causing performance issues. SSMS also allows DBAs to view configuration settings, query execution plans and other diagnostic information.
Another useful feature is performance analysis for SQL Server. Using the ‘Query Store’ tool, DBA’s can view execution plans and runtime performance for queries. This allows DBAs to understand if query performance has changed over time. If queries have slowed down, DBA’s can identify if the change in the execution plan has caused this issue. SSMS also allows DBAs to view reports and management features to allow regular management of databases. As this tool is focused on Microsoft SQL Server, this is very useful for organisations using these databases. However, if highly automated monitoring and advanced dashboards across multiple platforms is required, combining SSMS with dedicated monitoring tools may be beneficial.
9. Oracle Enterprise Manager
Oracle Enterprise Manager is an enterprise management tool that allows monitoring and management of Oracle databases and other supported infrastructure. It allows DBA’s to view availability, performance, resource usage and database activity in a centralized monitoring location. Performance analysis can be performed on Oracle databases, and metrics can be viewed to understand workloads in databases. DBAs can identify active sessions, resource usage, long running SQL queries, and key database components. This is extremely useful for large Oracle environments to understand the health and performance of databases.
Thresholds can be set, and incident management and alerts can be configured. DBAs can set thresholds for important performance metrics and be alerted if database activity goes beyond expected levels. Diagnostic and performance management features allow teams to identify issues, and understand optimisation improvements for databases. This tool can also be used to monitor multiple database fleets meaning it is useful for enterprises with multiple Oracle database instances. With many features available, this tool is a good choice for complex Oracle infrastructure. However, specialist knowledge may be required to implement and manage this tool, and consideration should be given to deployment requirements for the organisation.
10. ManageEngine Applications Manager
Applications Manager is an application & infrastructure monitoring tool. It can be used to monitor database performance. Relational and NoSQL databases including Oracle, Microsoft SQL Server, MySQL, PostgreSQL, MongoDB and Cassandra can be monitored. DBA’s can view database availability, response time, resource usage and query performance from a central monitoring location. As this tool can be used in multiple platforms, it is useful for organisations with a variety of different databases. It can also help teams understand how database performance may be impacting applications & services reliant on database data.
Query monitoring, dashboards and alerts can be used to allow proactive troubleshooting. DBA’s can view SQL queries, identify resource intensive queries, and identify issues such as slow performance, connection issues and excessive resource usage. Historical performance analysis can be performed, allowing teams to identify regular issues and understand changes in database performance. Another useful feature in this tool is the ability to combine database monitoring with application performance data. This allows DBAs to identify if slow application performance is due to database performance, resource limitations on servers or other infrastructure components. Consideration should be given to licensing options, supported integrations and monitoring requirements within this tool for organisations.
Considerations when Choosing Database Monitoring Tools
To make a good choice in choosing database monitoring tools, it is important to understand what features make these tools effective for efficient database administration.
Although tools vary, the following features are key for maintaining database availability, performance and reliability.
- Real Time Performance Monitoring
Real time performance monitoring allows DBA’s to understand key activity occurring in databases. By monitoring databases in real time, DBAs can quickly understand unusual changes occurring. Metrics to consider include query response time, transactions per second, concurrent connections, CPU, memory and disk usage. Understanding these metrics means that DBAs can understand how databases are performing with application requests and workloads.
Unexpected increases in query time may indicate inefficient SQL queries, blocking sessions, or resource contention. Having real time visibility of this information means that DBAs can investigate these conditions before they significantly impact users of applications.
- Identify Performance Issues
Database monitoring tools can highlight performance issues in SQL queries within the database. Slow, or resource heavy queries can cause increased CPU usage, increase I/O and therefore lower efficiency of other processes in the database. Tools that allow querying information regarding performance, query plan and comparisons to previous performance can allow administrators to diagnose performance issues. Using information on how frequently queries have been run, average query time and resource usage, along with other metrics, administrators can identify problematic queries.
This can lead to improvements such as index review, query simplification, and querying database query plans. Correct database query monitoring can improve application performance, allowing large volumes of work to be handled more efficiently within databases.
3. Resource Usage
Monitoring resource usage within the database can give insight into what resources are being used. Resources to monitor could include CPU usage, memory usage, disk I/O, network traffic and storage capacity. If resource usages are too high within the database, this can lead to slower and less reliable processes. High disk usage could result from low memory, and low storage capacity may affect database expansion and maintenance.
By monitoring resources, administrators can detect any limits within resources. It can also show whether any performance issues are due to infrastructural issues, or database workload. Recording historical resource usage can help with capacity planning. This can allow organisations to estimate future requirements and know if improvements to infrastructures may be required.
4. Alerting
Alerts can notify database administrators of important issues. Administrators can define alert rules to notify them of specific issues. This may include unavailability, high CPU usage, long query times, insufficient storage or irregular connection activity. A good alert system will allow administrators to understand the severity and nature of an issue quickly.
Some platforms allow for emails, messaging and other methods of alerts. However, it is very important to be careful with setting threshold values within alerting systems to avoid unnecessary alerts (due to overly sensitive thresholds) or missing important issues (due to thresholds not set correctly). A well designed alert system allows for quicker reaction, and can allow for proactive maintenance of the databases.
5. Historical Analysis
Using historical data in database monitoring allows administrators to identify trends in database performance. Although current data can be useful, historical data can allow DBAs to understand why performance varies in certain periods. Comparing the workload, recurring issues and seeing if improvements or inefficiencies have occurred as a result of changes in the database can be done using historical data. Within reports, information such as query performance, resource usage trends, availability, connection activity and storage growth can be seen.
This allows informed decisions to be made about infrastructure. It can also allow organisations to see how well their databases perform in comparison to their internal service expectations, and identify areas for improvement. Using monitoring tools with flexible reporting options makes it easy to relay performance information to technical teams and management.
Selecting Appropriate Database Monitoring Tools
To select appropriate database monitoring tools for your organisation, it is best to start with knowing what databases you have in place. If your organisation mainly uses PostgreSQL databases then tools such as pgAdmin or Percona Monitoring and Management may be appropriate. If your organisation uses Microsoft SQL Server, then SSMS may be useful for daily administrative functions and diagnosing issues. However, if your enterprise has many different databases, tools such as Datadog, SolarWinds DPA or ManageEngine Applications Manager may be more suitable. Care should be taken to ensure that the tool can support all database types in use. Not all tools will support all database engines, versions and models. You should also consider what type of infrastructure you have in place for your databases. This may be local servers, virtual machines, cloud or a combination of these.
Price, scalability, ease of use and integration requirements should also be considered. Some people may prefer open source tools such as Prometheus, Grafana and PMM for their flexibility. Alternatively, some people may prefer a commercial tool with central dashboards, support, automated reports and more observability. The impact on infrastructure, the impact on databases being monitored and permission requirements for data collection should be considered when choosing a monitoring tool. To get a feel for how a monitoring tool may perform, and to highlight any configuration issues, it may be a good idea to trial the shortlisted tools in a controlled environment. Ideally, choose a monitoring tool that gives enough visibility with minimal complexity and cost.
Best Practice with Database Monitoring
Within database monitoring, it is important to first decide what metrics to monitor in order to get the most useful information. Baseline levels can be set to allow for a snapshot of typical performance of the database. This means if performance differs significantly to baseline levels, an atypical issue may be occurring. Both database metrics and infrastructural metrics should be monitored. This is as performance issues may occur at any part of the system. For example, slow queries may be caused by inefficient queries, not enough memory, disk activity or application issues. Having both sets of metrics means administrators have a better understanding of database performance. Additionally, they can identify the real cause of issues, rather than assuming based on one metric.
Reviewing alerts, configuration and historical analysis regularly is also important. As applications change, the workload of the database may change. Therefore thresholds to trigger alerts may no longer be appropriate. Where necessary, thresholds should be adjusted. Redundant alerts should be removed and important alerts should be sent to the correct technical teams. Permissions should be given in line with best practice so that monitoring accounts only have the permissions needed to gain the required information. Teams should also document regularly occurring performance issues, actions taken to resolve issues and configuration changes. This makes processes much more consistent, reduces waiting times for problem solving and ensures reliable databases as operations change.
Challenges with Database Monitoring
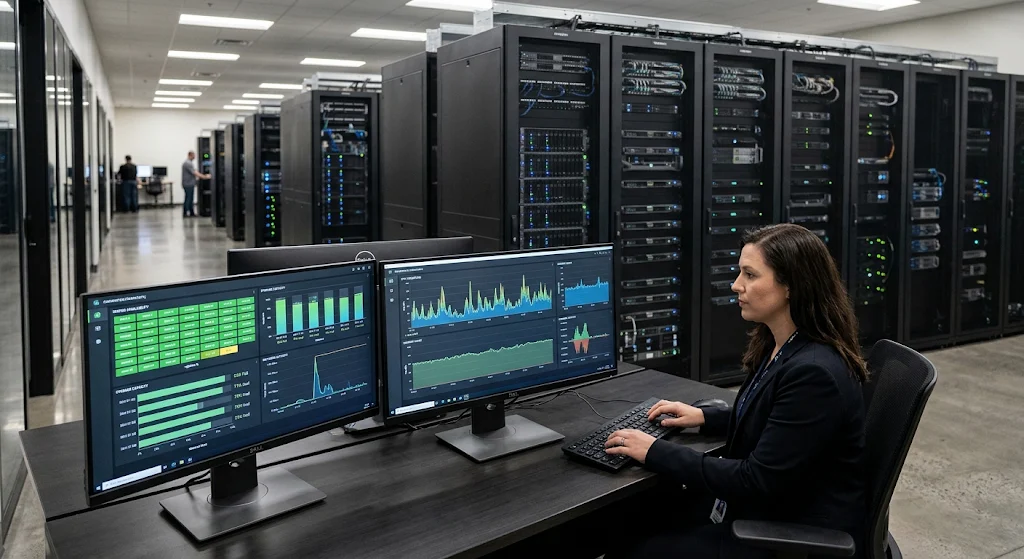
Despite the benefits that can be gained from database monitoring, there can be several challenges to be aware of. One challenge may be excess data. In large databases, monitoring tools may produce a large amount of data. This includes performance results, alerts and diagnostic information. This may make it difficult for administrators to identify critical issues. If thresholds are incorrectly set, too many alerts may be raised, meaning critical alerts may be missed. Another issue may be having multiple database types being monitored. Different databases provide different metrics and diagnostic information. Therefore, additional integrations or tools may be required to get consistent visibility over differing database types.
Care should be taken with security, compatibility and overhead. As monitoring tools often require access to database statistics, server information and operation logs, permissions should be configured carefully. Some monitoring tools may require agents/exporters to collect metrics, whereas others may require database connections/management tools. It is important to consider this to ensure that performance is not negatively impacted (in terms of resource usage and security). Additionally, care must be taken with software updates, database versions and integrations. If monitoring is not kept up to date with changes in databases, it may no longer provide accurate information. Planning and regularly reviewing database monitoring, alongside understanding the database architecture in place, will help overcome these challenges.
Conclusion
Monitoring databases is important to ensure reliable, available and efficient databases. As businesses become more reliant on databases for application performance, it is important that administrators can monitor query performance, resource usage, connections, storage and database availability. Many monitoring tools are available to allow this, including SolarWinds Database Performance Analyzer, Datadog Database Monitoring, Prometheus, Grafana, Percona Monitoring and Management, pgAdmin, MySQL Enterprise Monitor, Microsoft SQL Server Management Studio, Oracle Enterprise Manager and ManageEngine Applications Manager. Different tools offer different features, some offering in depth database diagnostics, customisable dashboards, infrastructure visibility, or database specific administrative features.
Depending on the database types being used, organisational requirements, scale of infrastructure, technical skillset, security requirements and budget, different solutions will be best suited. If an organisation has many different database types, a broad monitoring platform may be best, however if they only use one type of database, specific administrative tools may be most appropriate. Whatever tool is chosen, ensuring appropriate metrics are being monitored, appropriate alerts are set, regular performance reviews are conducted and proactively resolving issues will lead to efficient database monitoring. Choosing the correct database monitoring software, along with consistent database administration practices will allow issues to be identified quickly, improve resource management, reduce unexpected downtime and allow dependable database services.