Table of Contents
- Quick Summary
- What Are Support and Resistance Strategies?
- Technical Analysis Foundational Concepts
- Market Structure Chart Patterns
- Price Action Trading Frameworks
- Price Ceiling and Floor Trading Techniques
- Supply and Demand Zone Methodologies
- Key Level Breakout Systems
- How to Filter False Breakouts at Structural Pivots
- Determining Stop Loss Placement Using Horizontal Levels
- Combining Moving Averages with Historical Price Barriers
- Volume Profile Point of Control Reversals
- Fibonacci Retracement Confluence Mapping
- Multi-Timeframe Dynamic Trendline Validation
- Trading Methods Based on Psychological Price Barriers
- Market Pivot Level Execution Tactics
- Intraday vs Swing Trading Approaches
- Mechanical Indicators vs Discretionary Price Action
- Forex vs Cryptocurrency Markets
- Why Choose Bookmap
- Trading Costs and Platform Considerations
- Trustpilot Reviews and Trader Feedback
- Get Started with Bookmap
- Frequently Asked Questions
Quick Summary
Support and resistance strategies are among the most widely used approaches in technical analysis. They help traders identify potential turning points, breakout opportunities, and high-probability entry and exit zones based on historical price behaviour.
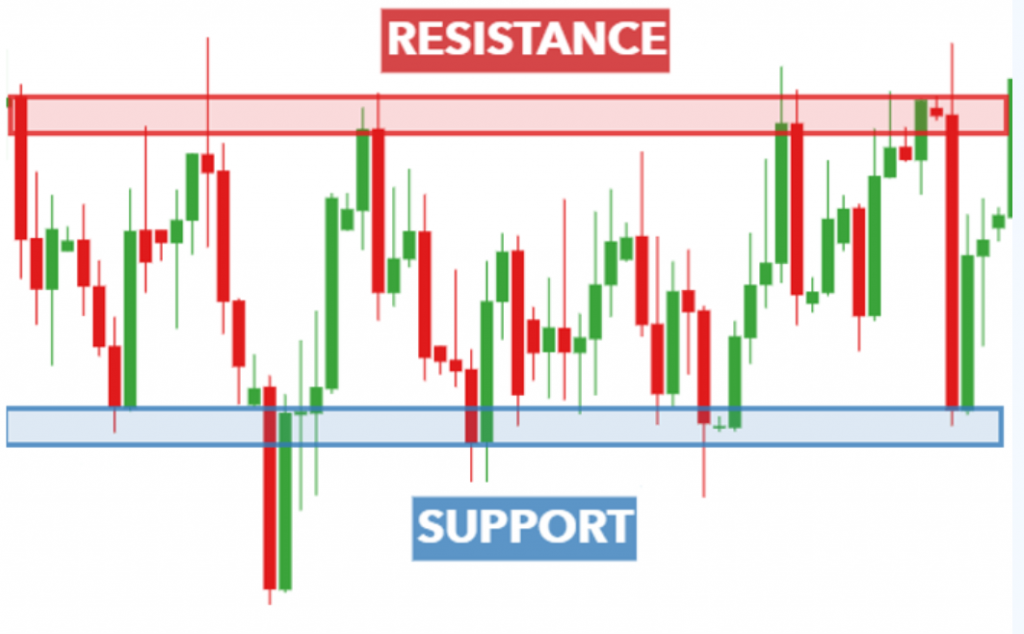
Support refers to an area where buying pressure has historically prevented prices from falling further. Resistance represents an area where selling pressure has historically capped upward movement.
Modern traders increasingly combine support and resistance analysis with order flow, liquidity data, volume profile, and market depth tools. Bookmap provides advanced visualisation technology that helps traders identify hidden liquidity, monitor institutional activity, and improve decision-making around key market levels.
Whether you trade forex, stocks, futures, or cryptocurrencies, support and resistance strategies remain a core component of professional trading.
What Are Support and Resistance Strategies?
Support and resistance strategies are trading methods based on psychological price barriers where market participants repeatedly react at similar levels.
Support levels often form when buyers believe an asset offers value, causing demand to outweigh supply.
Resistance levels develop when sellers view a price as expensive, increasing supply and limiting further gains.
These levels create opportunities for traders to:
- Enter trend continuation trades
- Trade reversals
- Identify breakout opportunities
- Manage risk effectively
- Establish profit targets
Bookmap helps traders visualise liquidity around these key levels, providing additional confirmation before entering trades.
Technical Analysis Foundational Concepts
Support and resistance are foundational concepts within technical analysis.
They provide a framework for understanding:
- Market psychology
- Buyer and seller behaviour
- Historical price reactions
- Liquidity concentration
- Potential future market movements
While indicators can assist analysis, support and resistance remain relevant because they reflect actual market participation rather than mathematical calculations alone.
Professional traders often begin their daily analysis by identifying significant support and resistance zones before considering any trade setup.
Market Structure Chart Patterns
Market structure plays a vital role in support and resistance trading.
Common patterns include:
Higher Highs and Higher Lows
Typically indicate an uptrend where support levels become increasingly important.
Lower Highs and Lower Lows
Suggest a downtrend where resistance levels frequently act as selling opportunities.
Range-Bound Markets
Price repeatedly moves between support and resistance boundaries, creating potential reversal setups.
Consolidation Patterns
Periods of indecision often precede significant breakouts.
Bookmap provides enhanced market visibility that can help traders understand how liquidity behaves within these structures.
Price Action Trading Frameworks
Price action trading frameworks focus on interpreting raw market movement without excessive reliance on indicators.
Common price action signals near support and resistance include:
- Pin bars
- Engulfing candles
- Inside bars
- Rejection wicks
- Break-and-retest patterns
These signals become more meaningful when they occur at historically significant levels.
Many professional traders use Bookmap alongside traditional chart analysis to gain a deeper understanding of liquidity and order flow dynamics.
Price Ceiling and Floor Trading Techniques
Price ceilings and floors represent another way of describing resistance and support.
Trading the Floor
When price approaches a well-established support level, traders often look for evidence that buyers are defending the area.
Potential confirmation signals include:
- Increased volume
- Order flow absorption
- Reversal candles
- Liquidity stacking
Trading the Ceiling
At resistance levels, traders may seek confirmation that sellers remain active.
Indicators include:
- Rejection wicks
- Large resting sell orders
- Decreasing momentum
- Liquidity concentration
Bookmap helps traders observe many of these behaviours in real time.
Supply and Demand Zone Methodologies
Supply and demand zones extend traditional support and resistance concepts.
Rather than focusing on a single price level, traders analyse broader areas where institutional buying or selling previously occurred.
Benefits include:
- Greater flexibility
- Reduced sensitivity to market noise
- Improved understanding of institutional participation
Bookmap’s heatmap visualisation can help identify liquidity concentratios within these zones.
Key Level Breakout Systems
Breakout trading is one of the most popular support and resistance strategies.
The objective is to capture momentum when price moves beyond a significant barrier.
Successful breakout traders often look for:
- Strong volume expansion
- Order flow confirmation
- Increased volatility
- Retests of broken levels
However, not all breakouts succeed, making confirmation essential.
How to Filter False Breakouts at Structural Pivots
False breakouts are among the most common challenges traders face.
Several methods can improve accuracy:
Wait for Confirmation
Allow price to close beyond the level rather than entering immediately.
Monitor Volume
Genuine breakouts typically occur alongside increased participation.
Observe Liquidity Behaviour
Bookmap enables traders to monitor liquidity pulling, stacking, and absorption around critical levels.
Retest Strategy
Many traders wait for price to revisit the broken level before entering.
These techniques can significantly reduce the number of false signals.
Determining Stop Loss Placement Using Horizontal Levels
Effective stop placement is critical to long-term success.
Support and resistance levels naturally provide logical locations for protective stops.
Long Positions
Stops are commonly placed below support.
Short Positions
Stops are often positioned above resistance.
Avoiding Obvious Placement
Many traders leave a small buffer beyond key levels to avoid being stopped out by normal market fluctuations.
Bookmap’s liquidity analysis can provide additional context for stop placement decisions.
Combining Moving Averages with Historical Price Barriers
Moving averages can strengthen support and resistance analysis.
Popular combinations include:
- 20-period moving average with intraday support
- 50-period moving average with swing levels
- 200-period moving average with major trend zones
When moving averages align with historical barriers, traders often view the area as having greater significance.
Confluence remains one of the most important concepts in technical analysis.
Volume Profile Point of Control Reversals
Volume Profile identifies where the greatest trading activity has occurred.
The Point of Control (POC) often acts as a significant support or resistance zone.
Traders frequently use POC reversals to identify:
- Mean reversion opportunities
- Trend continuation setups
- Institutional accumulation areas
Bookmap integrates volume analysis with liquidity visualisation, providing a comprehensive view of market structure.
Fibonacci Retracement Confluence Mapping
Fibonacci retracement levels are commonly used to identify potential reversal zones.
Key levels include:
- 38.2%
- 50%
- 61.8%
- 78.6%
The highest probability setups often occur when Fibonacci levels align with:
- Historical support
- Historical resistance
- Supply zones
- Demand zones
- Volume profile levels
This process is known as confluence mapping.
Multi-Timeframe Dynamic Trendline Validation
Professional traders rarely rely on a single timeframe.
Multi-timeframe analysis improves context and decision-making.
A typical process may involve:
- Identifying major support and resistance on higher timeframes
- Refining entries on lower timeframes
- Validating trendline alignment
- Monitoring liquidity behaviour
Bookmap enhances this process by providing detailed order flow visibility across market conditions.
Trading Methods Based on Psychological Price Barriers
Psychological levels frequently attract significant market attention.
Examples include:
- Round numbers
- Previous highs
- Previous lows
- Weekly closes
- Monthly opens
These levels often become self-fulfilling because large numbers of traders monitor them simultaneously.
Understanding psychological barriers can improve trade selection and risk management.
Market Pivot Level Execution Tactics
Pivot points are widely used support and resistance calculations.
Common applications include:
- Intraday trend identification
- Reversal trading
- Profit target planning
- Risk management
Many traders combine pivot levels with Bookmap’s liquidity analysis to increase confidence in trade execution.
Are You Focusing on Intraday Scalping or Long-Term Swing Trading?
Support and resistance strategies can be adapted to different trading styles.
Intraday Scalping
Focuses on:
- Smaller price movements
- Higher trade frequency
- Lower holding times
Swing Trading
Focuses on:
- Larger market moves
- Multi-day positions
- Higher timeframe levels
Bookmap supports both approaches by providing real-time liquidity and market depth analysis.
Do You Prefer Mechanical Indicator-Based Levels or Discretionary Price Action?
Both approaches have advantages.
Mechanical Approaches
Use predefined rules and indicators.
Benefits include:
- Consistency
- Reduced emotional influence
- Easier backtesting
Discretionary Approaches
Allow traders to interpret market context dynamically.
Benefits include:
- Greater flexibility
- Adaptability
- Market nuance recognition
Many successful traders combine both methods.
Is This Intended for Highly Liquid Forex Pairs or Volatile Crypto Assets?
Different markets require different approaches.
Forex Markets
Benefits include:
- Deep liquidity
- Tight spreads
- Consistent participation
Cryptocurrency Markets
Benefits include:
- High volatility
- Frequent opportunities
- 24/7 trading
Bookmap is widely used across multiple asset classes to improve understanding of market behaviour.
Why Choose Bookmap
Bookmap has become one of the leading platforms for traders seeking deeper market transparency.
Advanced Liquidity Visualisation
Bookmap transforms complex order flow data into intuitive visual insights.
Professional-Level Analysis
Bookmap helps traders understand market behaviour beyond traditional charting.
Faster Decision Making
Real-time liquidity data enables more informed execution.
Trusted by Traders Worldwide
Bookmap is used by retail traders, proprietary firms, and professional market participants globally.
Extensive Educational Resources
Bookmap provides training materials, webinars, and educational content to help traders improve their skills.
Multi-Market Coverage
Bookmap supports futures, equities, cryptocurrencies, and other actively traded markets.
Whether you’re new to support and resistance trading or an experienced professional, Bookmap offers tools designed to enhance your trading performance.
Trading Costs and Platform Considerations
When evaluating trading platforms, consider:
- Subscription fees
- Data costs
- Broker commissions
- Execution quality
- Platform reliability
Bookmap offers multiple pricing options depending on trading requirements and desired functionality.
To discuss your specific needs, speak to an expert or get started with Bookmap today.
Trustpilot Reviews and Trader Feedback
Trust and reputation matter when selecting a trading platform.
Across Trustpilot reviews and trading communities, users frequently highlight:
- Improved market understanding
- Enhanced execution timing
- Better visibility into liquidity
- Valuable educational content
- Professional-grade analysis tools
Many traders report that Bookmap provides insights unavailable through conventional charting platforms.
Get Started with Bookmap
If you want to improve your support and resistance trading strategies, Bookmap provides powerful tools designed to help traders make more informed decisions.
Benefits include:
- Real-time liquidity analysis
- Market depth visualisation
- Advanced order flow insights
- Professional-level education
- Multi-market compatibility
Book a consultation, speak to an expert, or get started with Bookmap today to discover how advanced market transparency can improve your trading performance.
Frequently Asked Questions
What is the most effective support and resistance strategy?
There is no single best strategy. Many successful traders combine support and resistance analysis with volume, order flow, and liquidity confirmation.
Why do support and resistance levels work?
They reflect areas where buyers and sellers have historically reacted, creating repeatable market behaviour.
How can I avoid false breakouts?
Use volume confirmation, wait for candle closes, monitor liquidity behaviour, and consider retest entries.
Do professional traders use support and resistance?
Yes. Support and resistance remain core components of institutional and professional trading strategies.
Can support and resistance be used in crypto trading?
Absolutely. Support and resistance concepts apply across forex, stocks, futures, and cryptocurrencies.
How important is risk management?
Risk management is essential. Even highly effective strategies can fail without proper stop placement and position sizing.
Does Bookmap help identify support and resistance?
Yes. Bookmap helps traders visualise liquidity, order flow, and market depth, providing additional context around key price levels.
Is support and resistance suitable for beginners?
Yes. Support and resistance are among the most accessible and widely taught concepts in technical analysis, making them an excellent foundation for developing trading skills.