Introduction
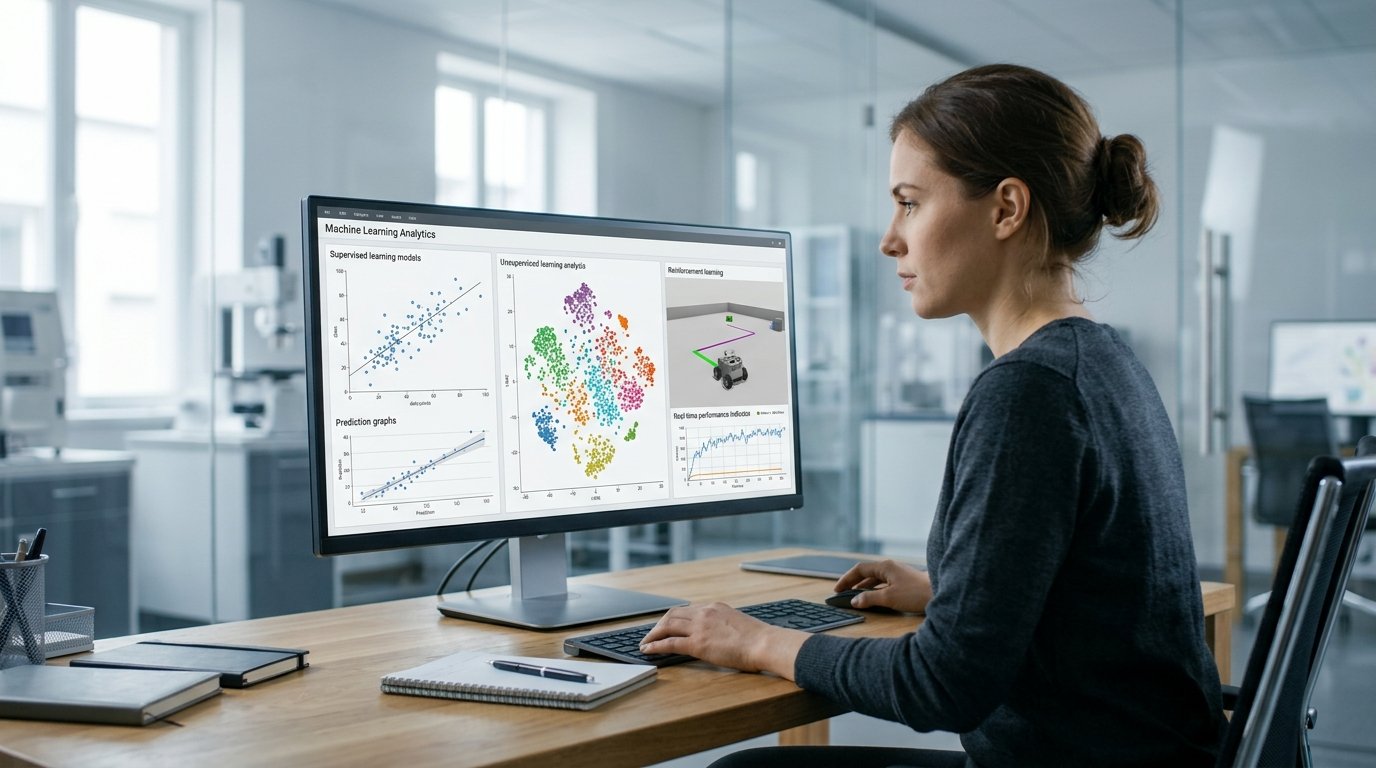
Machine learning algorithms are methods that enable computers to identify patterns in data and use those patterns to make predictions or decisions. Instead of programming each instruction out by hand, they have developed models based on past examples which in turn they use to recognize relationships and apply what was learned to new situations. In the field of business we see machine learning used for sales forecasting, fraud detection, email sorting, product recommendation, and analysis of customer behavior. These uses help companies to automate routine processes, improve efficiency, and make more informed decisions.
Different machine learning algorithms present different solutions to problems. Decision trees follow rules which they learn, random forests put together many trees, and neural networks which are made up of inter-connected computational layers also have them. Also we see that other methods like linear regression, logistic regression, support vector machines, and clustering do very well for certain types of analysis. Out of that, which algorithm to use is based on what the data is like, what the developer is trying to achieve, what computing resources are available to him, and also the level of prediction accuracy required.
Decision Trees: Learning by Rules.
Decision at trees which is what we call machine learning algorithms that put forth a prediction by way of a series of questions to the available data. They have a structure which is that of a flow chart which starts at a point we call the root node and then branches out into more questions till we get to a final prediction. At the time of training the algorithm determines which features do a best job of sorting out the examples. In the case of classification it looks at how well a split does at putting different categories in their own groups, for regression trees they look at which splits do a best job at predicting numerical results.
For instance a retailer may use a decision tree to predict if a customer will buy a product which is based on past purchases, navigation through the site, and present discounts. The algorithm identifies trends in historical customer data and uses that to predict future action. Decision trees are also very easy to interpret and therefore very useful for business analysis. At the same time large and complex trees may overfit the training data which in turn may not present the general trend. To reduce this issue developers may put a constraint on tree depth and also how branches develop out from nodes.
Random Forests: Combining Many Decision Trees.
Random forests outperform individual decision trees through the use of large numbers of trees. We usually see each tree trained on a different set of the training data and also to use random selection of features which it works with. In the case of classification issues the forest makes a choice based on a vote from the individual trees, for regression we tend to see the individual trees’ results averaged. This approach also decreases the impact of any one tree and in turn improves the results’ reliability.
A case in point is a bank which may use a random forest to detect fraudulent transactions by looking at transaction amounts, locations, purchase times, and unusual spending patterns. By using many trees the model is able to recognize various combinations of features that may indicate abnormal activity. This is one example of fraudulent transaction detection, where machine learning algorithms can help financial institutions identify suspicious payment patterns and decide when further investigation is necessary. Also random forests are used for customer analysis, sales forecasting and risk assessment. While they do tend to perform well on structured data, random forests require more computing resources than a single tree and also can be harder to interpret. Also developers must pay attention to performance issues when the dataset contains many more examples of one category as opposed to another.
Linear Regression: Predicting Number Values.
Linear regression is a supervised machine learning algorithm which we use to predict numerical results. It models the relationship between input features and a target value that it learns from the data. Also it determines the best fit line by which the minimum of the square of the difference between what is predicted and what is the actual value is obtained. Also it produces a model that reports how a change in one or more features will play out in the predicted variable.
For instance a company may use advertising spend, product pricing, seasonal trends, and past sales to predict future revenue. The model looks at past data and puts forth predictions based on what it sees. Linear regression is a quick, simple, and transparent tool that we put to use in development of forecast models and for business analysis. It does have issues with very non linear relationships between variables and also when odd data points play a large role in the results. As a solution developers put in place proper feature selection, transformations, and regularization when needed.
Logistic Regression: Classifying into Categories.
Log in to the world of supervised learning which is what we do with logistic regression, a very common tool we use to put info into categories. Instead of trying to predict any old number, what we do is we have it out put the probability that a given observation is of a certain class. In case of binary classification the model will present a probability between 0 and 1 which you can then compare to a chosen threshold to determine which category the object is finally put in.
Email systems may use logistic regression to tell the difference between spam and non spam messages, which also goes for financial institutions in which borrowers may default on a payment. The model uses labeled examples to identify patterns which it then applies to new cases. What we see is that logistic regression is a fast and relatively easy to interpret tool which is what organizations want in terms of results. That said it has issues with very complex relationships which in turn may require to include more features or do some data transformation. Also performance of the model is a function of the quality of the training data, choice of thresholds and also how we evaluate classification errors.
Support Vector Machines: Dividing Data Classes.
Support at arms machines which is what SVMs are also referred to as are supervised learning tools which we use for classifying data by which they identify the boundaries between different groups. What they do is try to identify a decision boundary which puts maximum distance between classes. It is the closest training examples which in turn are known as support vectors that play a role in the determination of this boundary. At times when a straight boundary is not sufficient for proper separation of the data we have kernel functions which we use to make the algorithm present more complex relationships.
For instance a business may use a SVM to sort customer emails into categories like billing issues, technical support requests, and account related questions. The model learns to identify what is which from labeled input and then it does the classification of the incoming communication. SVMs do well with large data sets which have many variables especially when the data is well prepared. But as data sets grow, training may become very compute intensive and also the choice of kernel and model parameters plays a great role in performance. Feature scaling is also an issue for many SVM applications.
Clustering Algorithms: Finding Unknown Groups.
Clustering in machine learning has a large role in unsupervised environments where we have no set labels and the aim is to bring out patterns. These algorithms put instances into groups based on which they are most similar. For example in K means we see data elements sorted into clusters by their distance from the cluster centers. Also there are other methods like hierarchical clustering and DBSCAN which present different ways to identify groups which may be by how other instances are related or by the density of the data points.
Businesses use clustering to determine customer segments by which they based on purchase history, spend trends, or product choice. A retailer may find out that there are groups of customers which regularly buy basics, prefer high end products, or are very responsive to seasonal sales. That information in turn supports targeted marketing, inventory planning and personal product recommendations. But clustering doesn’t produce perfect results. What you get out of it is based on the quality of the data you put in, feature choice, scaling, and the algorithm used. Also developers have to review the results to see if what is presented is of use to the business.
Neural Networks: Learning of Complex Structures.
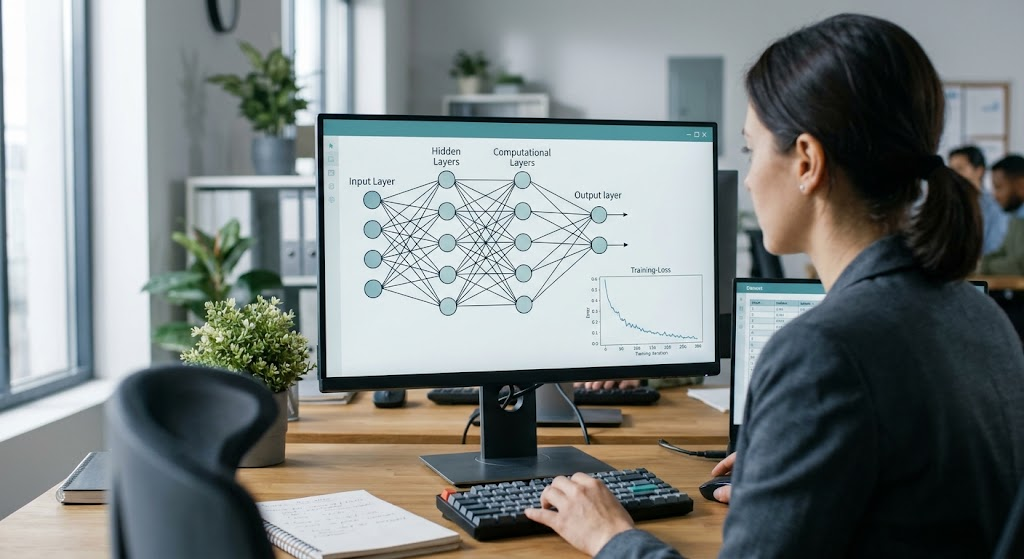
Neural networks are a type of machine learning model which consist of a series of connected computing units that are arranged in layers. In a basic design we have an input layer, one or more hidden layers, and an output layer. Each unit within these layers performs its function with what it has learned from the weights, biases, and an activation function. As the network goes through the training process it puts out predictions which are then compared to what the expected results are and it in turn changes its internal variables to reduce the error. Backpropagation is what we use to determine the changes that should be made to the parameters, and also we have optimization methods which put those changes into play during the learning process.
Neural networks do well at recognizing complex patterns in images, text, speech, and other types of data. For instance an online retailer may put in a system which uses neural networks to predict what a customer will buy based on past purchase data, seasonal trends, what products are which items are related to, and also past promotional activities. Also they are used in language processing, recommendation systems and image recognition. What they lack is large sets of training data and computing power which is a must for them to work well. Also their results may be hard to interpret which is why developers require good evaluation tools and constant performance assessment.
How to Choose the Right Machine Learning Algorithms

Select what algorithm to use is a function of first understanding the issue at hand and the type of prediction you are after. Linear regression does a good job at estimating numerical results, but for classification try out logistic regression and support vector machines. Decision trees put forth human readable rules, random forests which are made of many decision trees often outperform a single one, clustering does away with the need for pre defined labels and is used to identify groups in your data and neural networks which are very flexible are used for learning complex relationships. It is up to the developer to play with what works best in each case rather than to think that the most complex algorithm is the best.
Other key factors are dataset size, data quality, interpretability, computing requirements, and prediction accuracy. In some cases, a small data set which has a great need for easy to understand results may do better with a simpler model, while a large scale issue which plays with large sets of info may in fact do better with a more complex solution. Understanding data quality and predictive modelling is also important because machine learning algorithms depend on relevant, reliable information to produce useful predictions. Also at hand is the issue of what metrics to use for evaluation which may vary based on the problem at hand. For example in sales forecasting we may look at prediction errors, but for fraud detection we have to pay attention to precision and recall. Also it is important to test models on new data which you did not use in the training phase in order to see how well they perform out in the real world.
Conclusion
Machine learning algorithms present different approaches to analyze data, recognize patterns, and make predictions. In decision trees we see growth from learned rules, in random forests many trees are combined, linear regression which models numerical outcomes and logistic regression which predicts category probabilities. Support vector machines we see which put classes in separate groups, clustering algorithms which identify hidden groups of data, and neural networks which learn very complex relationships from the input.
Selecting the appropriate algorithm is a function of business goal, available data, required accuracy, interpretability, and computing resources. Developers to that end should try out various options, test performance on new data, and look at deployed models as conditions change. By this means companies may better apply machine learning to sales forecasting, fraud detection, customer segmentation, email classification and other practical issues.