Introduction
Financial reports present a picture of a company’s performance but the numbers don’t always tell the full story. We see companies report high revenues which at the same time are having trouble with payables or they may have great profits which in the same token are hiding large debts that put at risk their long term stability. That is why financial ratio analysis is a very important tool for business owners, investors, accountants and finance students. By using the balance sheet, income statement and cash flow statement data we are able to see beyond the raw numbers and out of that analysis we get relevant insights which in turn support better decision making.
Learning to analyze key financial ratios which allows stakeholders to determine if a company is in good financial health, doing well profit wise, operating efficiently and also if they are able to meet short term and long term liabilities. Instead of guess work ratio analysis gives out1 which are that which present strengths, which present weaknesses, which show trends, and which present risk. Whether you are looking at your own company’s finance report or at a prospect for investment what you are really doing is putting you in a better position to make informed and sure fire decisions.
In this in depth guide we cover what you need to know to calculate and interpret the main financial ratios which are current ratio, gross profit margin, net profit margin, debt to equity ratio, and return on assets. Also we will look at best practices for ratio comparison, common errors to avoid, and we include practical examples which make financial statement analysis easier to understand.
Why Financial Ratio Analysis Matters
Financial reports like the balance sheet and income statement do put forth important data but at the same time they present hundreds of numbers which do not include explanation of what each figure represents. Financial ratios fill in this gap by looking at related elements and presenting them in a way that brings out the relationship between assets, liabilities, revenues, expenses, and profits. Rather than just reporting that a company has $20 million in current assets ratio analysis determines if those assets are enough to cover what is coming due in the near term or if the business is doing a good job of generating a return from its resources. Also not only do accountants use this info but also entrepreneurs which are out to get funding, lenders which are determining credit worthiness, investors which are looking at what to put their money in and managers which are using it to watch performance over time.
In all sizes of business ratio analysis supports better planning and stronger financial management. If we see profitability ratio go down it may be that production costs are going up, also an increasing debt ratio may be a sign of growing financial risk. Also improved liquidity ratios may mean better cash management and greater flexibility during unexpected economic challenges. As industries vary greatly financial ratios should always be put into the context of industry average performance, historical company performance, and the overall business strategy. Numbers only truly mean something when looked at in the right context which includes how they are interpreted as much as calculated.
For better insight into what financial ratios mean it is best to look at sets of ratios as a group instead of a single figure.
Exploring the Main Types of Financial Ratios
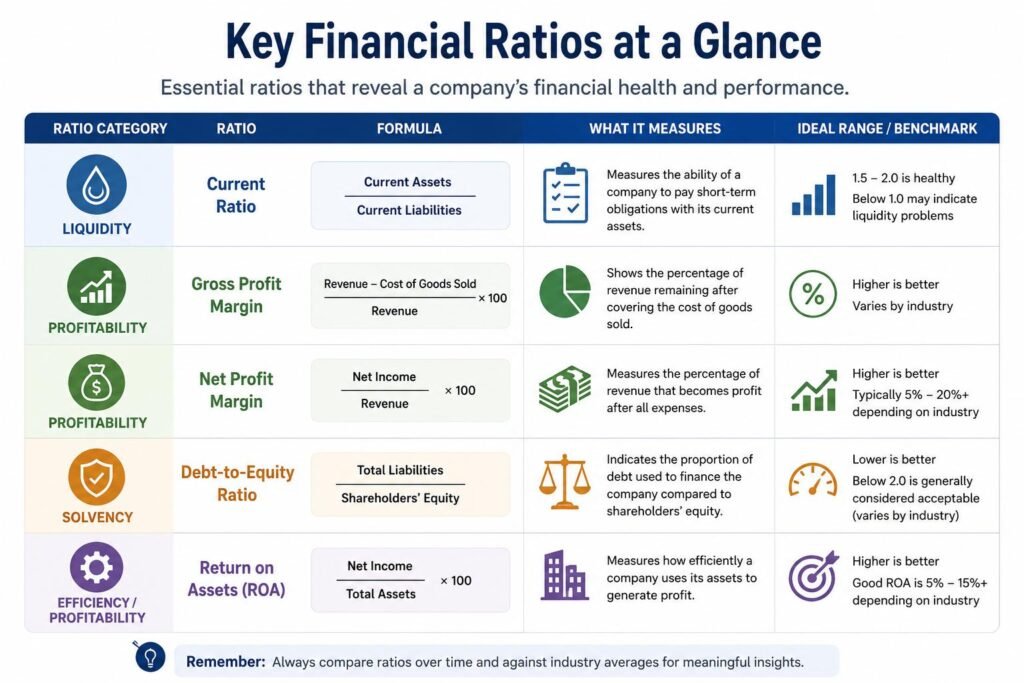
Financial ratios mostly fall into groups that which aspect of business performance they are looking at. Liquidity ratios look at whether a company is able to pay its short term debts with its current assets. Profitability ratios determine how well the business does at generating profits from sales, assets, or shareholder investment. Solvency ratios look at long term financial health via debt levels and financing structure. Efficiency ratios report how well management is at using company resources to generate revenue, and market ratios which in large part are for investors to study public companies. While there are many financial ratios out there what is more useful is to master a few key indicators which in turn give you a good base for business evaluation. The five ratios we cover in this guide are among the most used as they as a whole give you a good balance of views on liquidity, profitability, financial risk, and operational efficiency.
1. Liquidity Ratios
Current Ratio
The present ratio which is what we use to determine a company’s ability to pay off its short term debts with its present assets. It is a very simple at yet very important indicator of financial health because companies must have enough liquid assets to run day to day operations smooth. Current assets in this case include cash, accounts receivable, inventory and any other assets which we expect to turn into cash within the one year mark, and also we have current liabilities which are the debts that are due within that same time frame. A company which has insufficient liquidity may have trouble paying suppliers, employees, or lenders which in turn may affect the business even if it is doing well on paper.
Formula
Current Ratio= Current Assets/ Current Liabilities.
Example;
Suppose a company reports:
- Current Assets = ₦12,000,000
- Current Liabilities = ₦6,000,000
Current Ratio of 12,000,000 to 6, 000,000 which is 2.0.
Interpretation
A present ratio of 2.0 means the company has ₦2 of current assets for each ₦1 of current liabilities. Also:
- Above a certain high liquidity threshold which is around 2.0.
- Around in the range of 1.5 to 2.0 which is put forth as healthy.
- Below 1.0 means that there is a payment issue.
Also very high liquidity may point out instead to the inefficient use of assets which we see in very large inventories or unused cash.
2. Profitability Ratios
Gross Profit Margin
Gross profit margin is a measure of how well a company is producing or purchasing its products in relation to sales revenue. We look at this to see how much in production costs, which we call COGS, they are managing before we get into variable costs like operating expenses, taxes, and financing terms. Which companies report high gross margins are usually in a better position to handle operating expenses and to produce profits. Looking at the trend in gross margins over the years can also tell us if production costs are going up or if the company’s pricing strategies may require a change. Also investors tend to see in very good light when they see that gross margins are stable or improving which is an indicator of the company’s competitive edge and operational performance.
Formula
Gross Profit Margin= (Revenue-Cost of Goods Sold) Revenue x 100.
Example;
Revenue = ₦15,000,000
Cost of Goods Sold = ₦9,000,000
Gross Profit = ₦6,000,000
Gross Margin is 6,000,000 out of 15,000,000 which is 40%.
Interpretation
A 40% gross margin means that which company has 40 kobo out of every ₦1 of sales after they have covered direct production costs. What is also true is that a higher percentage indicates better pricing power or more efficient cost control.
Net Profit Margin
While in the case of gross margin we look only at production costs, net profit margin is the which out of revenue remains after we have accounted for all expenses that is, salaries, rent, interest, depreciation, taxes, and admin costs. Also what it shows is the company’s true financial health which is why it is perhaps the best indicator of performance. Even companies that do very well in terms of sales may still see poor net margins if they are not in control of their operating expenses. What we also see is that by tracking this ratio over time managers are able to find out which areas of expense they can reduce in order to improve profitability which may not in fact require an increase in revenue.
Formula
Net Profit Margin = Net Income ÷ Revenue × 100
Example;
Net Income = ₦2,100,000
Revenue = ₦15,000,000
Net Margin is 14% which is calculated as (2,100,000/15,000,000) x 100.
Interpretation
A net margin of 14% is that the company reports a profit of ₦0.14 for each ₦1 of revenue after they have paid all expenses. While large margins are an indicator of good financial health we do note that what is considered an acceptable level varies by industry.
3. Solvency Ratios
Debt-to-Equity Ratio
The debt to equity ratio is a measure of what amount of debt a business has in relation to shareholders’ equity. It also indicates the degree to which company operations are run on borrowed money as opposed to owner investment. Very high levels of debt increase financial risk which is present no matter the health of the business at the time. At the same time though moderate use of debt may support in growth and improved returns if used responsibly. This is a key ratio which investors and lenders look at to determine the company’s long term financial health and its ability to weather economic down turns.
Formula
Debt to Equity Ratio= Total Liabilities/Shareholders’ Equity.
Example;
Total Liabilities = ₦18,000,000
Shareholders’ Equity = ₦12,000,000
Debt to Equity Ratio= 18,000,000/12,000,000 which is equal to 1.5.
Interpretation
A ratio of 1.5 means that which the company has 1 of shareholder’s investment. What we see is that lower ratios in general indicate lower risk which is financial in nature, although it is a fact that utilities and banking in particular report higher leverage.
4. Efficiency and Profitability
Return on Assets (ROA)
Return on Assets which is a measure of how well the management is using the company’s assets to generate profit. As assets are the resources that go into producing goods and services, ROA in turn measures the overall operational efficiency. What we see in companies which have high ROA is that they use to much greater degree their equipment, inventory, buildings and other assets than do their competitors. This ratio also is very useful when comparing businesses of the same size in the same industry which have different asset requirements.
Formula
Return on Assets= Net Income/Total Assets x 100.
Example
Net Income = ₦3,000,000
Total Assets = ₦30,000,000
ROA= (3,000,000/30,000,000) x 100 = 10%.
Interpretation
An ROA of 10% means that which the firm generates ₦0.10 in profit for each ₦1 invested in assets. Also which is a larger percentage it indicates that the company is better at using its assets.
How to Interpret Financial Ratios Correctly
Determining ratios is just the first step in thorough financial analysis. Interpretation is a process which also includes study of industry standards, company history, size of the business, economic conditions, and management approach. For instance a current ratio of 1.3 may be weak for one company but in industries that see quick inventory turnover and stable cash flow may in fact be very good. Also a high debt to equity ratio may work for businesses that have very predictable and recurring income which in turn may present great risk for companies in very volatile markets. What we see is that ratios are best analyzed in relation to industry average performance, competition, and past performance of the company itself instead of in a vacuum. By looking at multiple ratios as a set we get a much better picture of a company’s financial health then we do from any single measure.
Common Pitfalls in the Use of Financial Ratios
One out of the gate issues we see is that which companies are at a financial health standstill is determined by a single ratio. Each ratio only tells a piece of the picture which is why we have in depth analysis as a requirement. Also it is very common to see comparison of businesses in different industries which do in fact have different financial structures. Retail, manufacturing, software, and banking run on different financial models so it is better to use industry specific benchmarks rather than universal standards. Also we see that which analysts rely on old financial reports, which does not take into account seasonal changes, or they ignore at large one-time events that which do in fact distort the results. Also at no point should ratio analysis be looked at as a standalone, it should also include the quality of management, the competitive standing of the company, customer satisfaction, and what the prospects are for growth in the future for a more full business evaluation.
Best Practices for Financial Statement Analysis
Successful financial statement analysis is not a matter of just inputting data into formulas. Instead analysts should look at multiple years of reports to identify trends which in turn will give more value than a single report period. We see also that which ratios perform in relation to industry average, what is happening quarter over quarter, we as analysts must study accounting policies and look at the economic climate which plays a role in coming to better conclusions. Also businesses should set internal ratio benchmarks and8 constantly review them as part of their performance management. Use of accounting software and score cards which may also be referred to as dashboards which in turn simplify ratio calculation and reduce human error allows management to put more energy into what the numbers mean and into strategic decision making. In the end what we do with financial ratio analysis is not about the numbers themselves but what we do with that information to increase profit, to manage risk, to improve cash flow and to support the company’s long term growth.
Conclusion
Financial ratios which present in a simple and useful way the complex issue of financial statements thus support in the process of taking informed decisions. We see this in the use of liquidity ratios which are like the current ratio, profitability which we look at in terms of gross and net profit margin, solvency which is identified via the debt to equity ratio, and efficiency which we look at in return on assets. What happens is that through these ratios stakeholders get a better picture of a company’s financial health than what is put forth in the accounting reports. Also these ratios play a role in bringing to light what the companies’ strengths are, what their weaknesses may be, in what ways they are performing in terms of past trends, and in what direction strategic plans should go.
No single ratio is enough, that is why in effective financial analysis we present several metrics at the same time and we also look at industry norms and historical performance. As a small business owner looking to gain better financial control, an investor which is looking to compare between different investment options, or a student that is developing their analysis skills, by mastering these main ratios you will be able to make more confident and data based financial decisions. By doing regular ratio analysis along with what is known about the business, you still have one of the best tools to determine a company’s financial health and long term sustainability.
Get more well researched information on how to Analyze Financial Statements Using Key Ratios here.