
Introduction
Memory management is one of the most important components of an operating system. In UNIX based systems, memory management allows several applications to be more efficient. Developers will need to understand virtual memory, how memory is allocated and how the operating system manages memory.
Understanding concepts such as stacks, heaps, pointers, mapping and sharing memory, and page faults will have a big effect on Application Performance. Understanding how memory is managed in UNIX based systems can help programmers detect memory leaks, reduce unnecessary resource usage and develop applications that work efficiently.
Memory Management
Memory management is a process that ensures memory is allocated to an application. As applications will run, they all need memory to store instructions, variables, data and other information. UNIX Operating Systems give each process their own virtual memory space.
Memory management allows applications to not have access to physical memory, but instead translates virtual addresses into physical memory using memory management. This helps with improving security, making it easier to develop applications and allows multiple processes to run. Developers will be able to use interfaces to manage memory.

How Applications Use Memory in UNIX
When an application runs in UNIX, a virtual memory space will be created by the operating system. There are several sections of memory including text, initialised data, uninitialised data, heap and stack. Text stores instructions, whilst initialised and uninitialised data store global/static variables.
Heap is used for dynamic memory. The stack stores parameters, local variables and returns. Depending on the operating system, processor and security settings, the memory will be split into sections. This will help developers understand how memory is organised. Knowing what each section does will help developers spot any issues with memory allocation.
Virtual Memory in UNIX
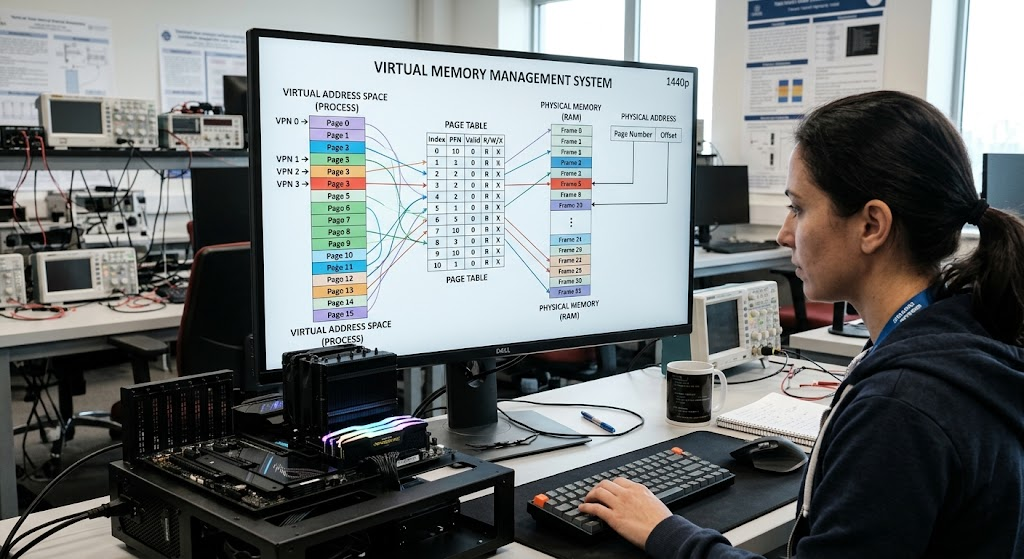
Virtual memory is a way to manage memory. This allows applications to use virtual memory addresses. Each process will have their own virtual memory space meaning they look like they have their own continuous memory. The operating system and processor will work together to translate virtual addresses into physical memory addresses.
This is usually managed using page tables. This allows the operating system to be more flexible with how memory is managed. Only the necessary pages will be loaded into memory. This is important if there are multiple applications needing to access memory.
Virtual Memory Spaces
Virtual memory spaces are a range of memory addresses that can be used. Each process will usually have their own virtual memory space to stop one application accessing another’s private memory. For example, if there was a database application running, it would store information about queries, caching and temporary calculations in its virtual memory space.
If there was another application running at the same time, it would have its own virtual memory space. The operating system will handle how the virtual memory addresses relate to physical memory. This will improve security and reliability for your applications. Processes can use familiar memory addressing techniques. It also allows for controlled sharing of memory.
Pages and Page Tables
Virtual Memory is often split into fixed sized blocks called pages. Physical memory will also be split into blocks called frames. The operating system will use page tables to store information about how virtual pages relate to physical frames. When a program tries to access a virtual memory address, the processor will use the memory management unit to find the physical memory address.
Page tables also store information about the permissions of memory. This means the operating system can enforce memory protection. Developers won’t usually need to manage page tables but knowing what they do can help you understand why there may be delays when accessing memory, page faults and why there may be performance differences when accessing large amounts of data.
Stack and Heap Memory
Stack and Heap memory are very important parts of applications. Both store data but are used for different reasons. Stack memory will usually be managed automatically. This makes it useful for storing local variables. Heap memory allows dynamic memory allocation. This means programs can request new memory whilst they are running and keep the memory for longer than individual function calls.
Developers will need to understand the difference between the two. If memory isn’t allocated correctly, this can cause wasted resources, crashes and unpredictable performance. Choosing the right method for allocating memory depends on how long the data will be used for, how big it is and how it will be used.
Stack Memory
The stack is used to manage function calls and local variables. When a function is run, a stack frame will be created containing information such as local variables, parameters and return addresses. When the function finishes, the stack frame will automatically be removed. This generally means stack memory can be accessed quickly. However, there can be limited stack memory.
If an application uses too much stack memory, it could cause issues with stack overflow. This can happen if there is deep recursion, large local arrays or functions with large stack frames. Programmers shouldn’t put unnecessarily large data structures onto the stack especially if the application will be dealing with large datasets.
Heap Memory
Heap Memory is used when an application needs to allocate memory dynamically. This means developers can request memory when they don’t know how much or how long they need it for. In C, there are common methods such as malloc(), calloc(), realloc() and free() to manage heap memory.
For example, if there was a data processing application, an array could be allocated. Developers will need to free dynamically allocated memory. If this isn’t done, it can cause memory leaks. Incorrectly allocating or freeing memory can cause instability in the application. Efficiently managing heap memory is important for long running services.
Example of Stack and Heap Memory
Below is an example of stack and heap memory in C:
#include
#include
int main() {
// Stack allocation
int number = 100;
// Heap allocation
int values = malloc(5 sizeof(int));
if (values == NULL) {
return 1;
}
for (int i = 0; i < 5; i++) {
values[i] = i * 10;
}
printf(“Stack value: %d\n”, number);
printf(“Heap value: %d\n”, values[0]);
free(values);
return 0;
}
This example shows how the number variable will be automatically managed using the stack frame. The array values are dynamically allocated using the heap. The malloc() function will request 5 integers worth of memory. This will return a pointer to the allocated memory. The program will check that memory has been allocated. Once the program has finished, the free() function will be called to free the allocated memory. This shows why developers will need to understand the difference between the two as they have different lifespans.
Pointers and Memory Addresses
Pointers are variables that store memory addresses. They are an essential part of C and C++. They allow developers to access dynamically allocated memory, manage arrays, pass data efficiently between functions and interact with operating system interfaces. In UNIX programming, pointers are often used with memory allocation functions, file mapping and Shared Memory.
If pointers aren’t managed correctly, this can cause serious issues. A pointer could be pointing to memory that has been freed, out of bounds or an invalid address. Developers should understand how pointers are owned, lifespan and how to check for bounds. Correctly managing pointers will help to avoid memory corruption and improve reliability for applications that use a lot of memory.
Common Pointer Issues
There are several issues that can occur when using pointers incorrectly. Null pointer dereference can occur when an application tries to access memory using an invalid pointer. Dangling pointers can occur when the pointer points to memory that has been freed. Buffer overflows can also occur when a program tries to access out of bounds memory.
This can cause unexpected behaviour, crashes and security issues. Developers can help reduce the risk by checking memory has been allocated, initialising pointers, checking for array bounds and setting pointers to NULL once the memory has been freed. Using debugging tools and memory sanitisers can help detect pointer issues.
Memory Leaks and Performance
A memory leak occurs when an application allocates memory but doesn’t free it. If there is a small memory leak, it may not cause any issues for short running programs, however if there are multiple memory leaks, memory usage can increase over time. This can cause issues for database applications, background services and server processes.
The OS may need to reclaim resources more often and move inactive pages to swap. This can cause delays and affect performance. In extreme cases, there could be memory pressure affecting multiple applications. Developers should ensure there are clear rules for who owns the memory. All dynamic allocations that are successfully allocated should have an appropriate freeing function.
Example of Memory Leak
Below is an example of a memory leak:
#include
void process_data() {
int data = malloc(1000 sizeof(int));
if (data == NULL) {
return;
}
// Process the allocated data
// Missing free(data)
}
This function is allocating memory for 1000 integers. Memory isn’t being freed before returning. Every time this function is successfully run, another allocation could be lost to the allocator. If this function is run multiple times, this can cause unnecessary memory usage. This can be fixed by freeing the allocation:
free(data);
In larger applications, memory ownership can become more complex. Objects could be passed between functions. Developers should ensure it’s clear who owns the memory and clean it up accordingly. Using tools such as AddressSanitizer and Valgrind can help detect any memory leaks or issues.
Mapping Memory with mmap()
UNIX has a feature to map files or objects into a processed virtual memory space. This can be achieved using the mmap() system call. This will map the virtual memory of the process to a file or memory object. Instead of constantly reading the data from the file, the data can be accessed using memory addresses.
This can make file processing easier and can improve performance if used correctly. It can be useful for large files, databases and applications that need to access specific parts of stored data. However this will depend on how the data is accessed, how much memory is available, how fast the storage is and how the OS behaves.
How mmap() Works
The mmap() function will map memory in the virtual memory space of the calling process. The general syntax is:
void mmap(
void addr,
size_t length,
int prot,
int flags,
int fd,
off_t offset
);
The parameters will determine where the memory should be mapped, how much memory should be mapped, what protections should be applied to the memory, what type of mapping and the file descriptor. For example, a developer could use mmap() to map a file into memory. The OS will manage the mapping between the memory and file. The pages may only be loaded into memory when accessed. This can be useful for applications that need to access large datasets efficiently. Developers should ensure there are error checks in place.
Example of Using mmap()
Below is an example of mapping a file into memory:
#include
#include
#include
#include
#include
#include
int main() {
int fd = open(“data.txt”, O_RDONLY);
if (fd == -1) {
perror(“open”);
return 1;
}
struct stat file_info;
if (fstat(fd, &file_info) == -1) {
perror(“fstat”);
close(fd);
return 1;
}
if (file_info.st_size == 0) {
close(fd);
return 0;
}
size_t length = file_info.st_size;
char *data = mmap(
NULL,
length,
PROT_READ,
MAP_PRIVATE,
fd,
0
);
if (data == MAP_FAILED) {
perror(“mmap”);
close(fd);
return 1;
}
write(STDOUT_FILENO, data, length);
munmap(data, length);
close(fd);
return 0;
}
The program will open the file and get the size. It will then create a read only mapping using mmap(). The data can then be accessed using the data pointer. The write() function will print the data. The munmap() function will free the mapping. The file descriptor will also be closed. This shows how easy it can be to access a file using memory mapping. In real applications, developers should consider if the file will be modified, what permissions are applied to the mapping, if the file size will change and error checking.
Shared Memory in UNIX
Shared Memory is a way to communicate between processes. Multiple processes can access the same memory. Instead of constantly reading/writing data to a file, processes can read/write to the Shared Memory. UNIX systems support Shared Memory using interfaces such as POSIX and System V. This can be a good way to communicate if large amounts of data needs to be passed between applications.
For example, a database service could use Shared Memory to store information that multiple workers need to access. However, there will be synchronisation issues as multiple processes may try to modify the same data. Developers should use the correct synchronisation methods.

POSIX Shared Memory
POSIX Shared Memory provides a standardized way to create Shared Memory. Common functions used are shm_open(), ftruncate() and mmap(). A process will create/open a Shared Memory object and set the size. It will then map the memory. Other processes can open the same object and create their own mapping.
This can help multiple applications access the same memory. However, there isn’t any automatic synchronisation between processes. Developers should use synchronisation tools such as POSIX semaphores or process shared mutexes.
Page Faults
Page faults occur when a process tries to access a page in virtual memory that can’t be accessed. The OS will handle this and decide if it is a valid request. Not all page faults are errors. Minor page faults can occur if the page is available in memory but needs to be updated.
Major page faults generally occur when data needs to be retrieved from storage. These are normal occurrences but too many major page faults can cause performance issues. Developers should understand how page faults work when dealing with large datasets or memory intensive applications.
Minor and Major Page Faults
Minor page faults occur when the OS can resolve the issue without going to storage. For example, if the process is trying to access a page that is already in memory but hasn’t been mapped yet. Major page faults occur when the OS needs to go to storage to retrieve the data.
As storage is generally slower than RAM, having too many major page faults can cause the application to run slower. Developers can use performance tools such as getrusage() and vmstat to investigate these. Knowing the difference can help programmers understand if there are issues with memory access due to virtual memory or more serious memory pressure.
Memory Protection in UNIX
Memory protection stops applications accessing memory in a way that could harm data or other processes. UNIX systems will use hardware and OS to enforce memory protection. Memory can be set to be readable, writable, executable or inaccessible. For example, executable instructions could be mapped with read and execute permissions.
Data could be readable and writable but not executable. This helps to avoid accidentally corrupting memory and reduces the impact of certain security issues. Developers can interact with memory protection using interfaces such as mprotect().
Understanding Memory Protection Flags
The mprotect() system call allows developers to change the permissions of memory pages in the processes address space. Common protection flags include PROT_READ, PROT_WRITE, PROT_EXEC and PROT_NONE. These will determine if the memory can be read, changed, executed or accessed. For example, an application could allocate a section of memory for data processing.
Once the data has been initialised, write permissions could be removed to avoid accidental changes. However, changes to memory protection should take into account page alignment and what the mapping will be used for. Developers should be careful when using these as incorrect permissions could cause segmentation faults and stop the application from doing what it should.
Common Memory Issues on UNIX
Memory issues can affect the performance of your application. This can be due to high memory allocation, fragmentation, leaks, inefficient access and unnecessary copying of large buffers. When large amounts of data is being processed or your system has limited physical memory you may notice some of these issues.
If your service needs to allocate temporary buffers frequently then it may result in high memory overheads. If your application has unpredictable memory access it can cause more page faults. You should ensure you look out for memory usage and access in your application.
Fragmentation
Fragmentation is when the available memory is split into chunks which can cause inefficiency. There are two types of fragmentation, external and internal. External fragmentation can occur if the free memory is split into multiple pieces and internal if there is unused space in the allocated memory chunk. Whilst modern memory managers and virtual memory reduce some of these issues they may still cause inefficient memory usage.
If you have a service that requires allocating and freeing of different sized objects frequently then this could cause inefficient memory usage. You can reduce this by reusing suitable buffers, choosing the right allocation method and avoiding unnecessary allocations. If you have large amounts of small objects you could consider using a memory pool or specialised memory manager.
High Allocation
Allocating memory for temporary usage can cause high overheads. If you have a data processing application that creates a new buffer every time it reads a small set of records then it could be causing a lot of memory overhead. You can improve this by allocating a buffer once to be reused.
This will help reduce the number of allocations being made and also make the memory usage more predictable. You should also ensure your data structures are not too large. Storing unnecessary data will increase memory usage. Using efficient allocation methods will be very useful if you have a high performance service, database or large data processing application.
Investigating Memory Issues on UNIX
If you have an application that is performing slowly, having unexpected memory growth or crashing then you need to ensure you have reliable ways of investigating. UNIX has several command line tools and programming tools to help you find memory usage, allocation issues and page faults. You can use these tools to see what processes are taking place, what resources are being used and to investigate any memory issues.
Top and ps can help you see what processes are running. Free will tell you about the general memory available. There are more specialised tools to help you find memory leaks, invalid memory access and inefficient allocation. Using system tools and application profiling will give you a better understanding of what is going on.
Using Top and Ps
Top will show you a live view of your processes and what resources they are using. This can help you to see what CPU, memory and process id’s are being used. Ps will give you a snapshot view of your processes. This can help you to see how much memory a particular application is using. For example:
top
You can also use ps aux to look at a specific process:
ps aux | grep application_name
This will help you to see what processes are using a lot of memory. You should also understand that virtual memory size and resident set size are different. Just because a process is using a large virtual memory size does not mean it is using a large amount of RAM. Looking at how these values change can help you to see if there is any suspicious memory growth.
Using Free and Vmstat
Free will display information about your total memory, how much is being used, how much is available and swap usage. This can help you get a quick view of your memory usage. Vmstat will give you extra information about virtual memory. This can tell you about page faults, swapping, CPU usage and processes. For example:
free -h
vmstat 2
Vmstat will update every two seconds. This can help you to see what is happening whilst your application is running. If you see high swapping or unusual page faults it can indicate that your application is putting a lot of pressure on your memory. You should also understand that this should be used in conjunction with your application and other system metrics.
Memory Profiling and Debugging
Memory profiling will help you to see how your application is allocating, using and freeing memory. This can help you to see which parts of your application are using the most resources and optimize them. Memory debugging will help you to find any errors in your code.
These can include memory leaks, invalid memory access and buffer overflow. Understanding these issues can be very important. Your application may be producing the correct results but using a large amount of memory. By collecting allocation statistics and looking at memory usage you can identify any inefficient operations and fix the issue.

Using Valgrind
Valgrind is a popular debugging and profiling tool. It has several tools that can help you find Memory Management issues. Memcheck can help you find memory leaks, invalid read/write and using uninitialised memory. To run this on your compiled application you can use:
valgrind –leak-check=full ./application
Whilst your application runs Valgrind will track your memory usage. It will then provide you with information about any issues found. This can help you identify which functions are allocating memory that is not being freed. This is very useful to use during development. It can help you identify issues which may not be noticed until your application has been running for a while. Using this will cause some overhead but can greatly simplify your memory debugging.
Using AddressSanitizer
AddressSanitizer is a memory error detection tool that is built into modern versions of GCC and Clang. It can help you find issues with your application such as heap/stack buffer overflow, use after free and certain memory leaks. To use this you can compile your C/C++ application using:
GCC -fsanitize=address -g program.c -o program
Once compiled you can then run your application. AddressSanitizer will tell you about any memory issues found. The error messages will often tell you where the issue was with the invalid memory operation and which allocation it relates to. This can help you to identify any programming errors. This will be very useful to use if your application is using lots of pointers, large buffers or custom Memory Management. You should use this in conjunction with normal testing.
Using Massif
Massif is a Valgrind profiling tool that can help you see how much heap memory your application is using. This can help you to understand how much heap memory your application is using and what parts of your application are using the most. This can be useful if your application has memory growth or is using large amounts of temporary data. To use this tool you can run:
valgrind –tool=massif ./application
You can then use the visualisation tools to see what memory issues you have. You can see when your application has high memory usage and what functions are causing large allocations. This can be very useful for database applications, large scale data processing and high performance services. Understanding how your application is allocating memory can help you decide if you should reuse buffers, reduce object sizes or change the way you process your data.
Optimising Memory Usage on UNIX
Optimising memory usage can be done by reducing unnecessary memory usage and ensuring your application is using memory efficiently. You should first profile your application to understand what is happening. Once you have identified any memory intensive operations you can optimize them by reusing buffers, using efficient data structures, choosing the right allocation method and reducing data copying.
If you have an application that processes large files you could consider memory mapping. If you have a service that frequently exchanges data between processes then you could consider using shared memory. However this will not always be faster and depends on your workload, available memory, memory access and how the OS manages memory.
Reusing Buffers
A simple way to reduce memory allocation is to reuse your buffers. Instead of allocating a new buffer every time you process some data you can allocate a suitable buffer once. This can reduce the overhead of the memory allocator. For example, if you have a network service which processes thousands of requests you could have buffers that are reused for receiving/processing data.
Before processing the next request you can clear/update the buffer. You should ensure your buffers do not contain old data and are large enough. If done correctly this can help improve the efficiency of your application if it performs repetitive data processing.
Efficient Data Structures
Choosing the right data structures can greatly affect your memory usage. Linked lists will take up more memory due to pointers being used. Dynamically allocated arrays will generally be more compact. Hash tables can be efficient but will often require extra memory for unused space and collision management. You should choose data structures based on what operations your application is performing frequently.
If you frequently search for records then using a suitable indexing structure could help. If your application processes data in sequence then using arrays/buffers can be efficient. Understanding how data structures impact memory usage and access can help you create more efficient UNIX applications.
Improving Memory Access
How you access your memory can impact how efficiently your application runs. Often sequential memory access will be efficient as data in sequence will often be loaded into the processor’s cache. If you have unpredictable memory access then you could have more cache misses.
For example, if your application frequently uses pointers to access unrelated memory then it may be slower than if it accessed contiguous arrays. You can optimize this by grouping related data together. This will help keep your data localised. Processing data in batches can also help. This is very important for database engines, scientific computing and large scale data processing applications.
Real World Uses
Many areas of development will require you to understand Memory Management on UNIX. Databases will require memory to store caches, indexes, transaction data and temporary query results. Large scale data processing applications will require efficient allocation methods.
Performance sensitive services will require predictable memory usage. Applications running on embedded devices will require careful Memory Management due to the limited amount of RAM. Understanding virtual memory, memory mapping, shared memory and profiling can help you to choose the best methods for your application. This can also help you to investigate any performance issues.
Database Applications
Database applications will heavily rely on Memory Management. Database engines will use memory buffers and caching to reduce unnecessary storage. Memory mapping can be useful if you are using files to store database records/indexes. If you have inefficient allocation this can reduce the amount of RAM available for useful database operations.
For example, if you have too many temporary allocations then this could reduce the amount of cache memory available. When developing database software you should ensure you are monitoring your memory usage, looking at memory access and optimising your allocation methods. Using profiling tools can help you to identify any functions that are using a lot of memory.
Large Scale Data Processing
Applications that process large amounts of data may not have enough physical memory to store all of the data. Using methods that process data in smaller batches, reuse buffers and only use the required data can help. If your application can access large files in an efficient manner then memory mapping can help.
For example, if you have a data analysis programme you could map the file and process specific sections. This can help reduce unnecessary memory usage. You should also monitor page faults. If you have inefficient memory access then you may have unnecessary storage operations.
Performance Sensitive Services
Performance sensitive services will often have frequent requests. Examples of this include network servers, financial processing and real time data services. Using efficient allocation can help improve performance. If your application has frequent requests then poor Memory Management can cause high allocation overhead. Reusing buffers, using suitable data structures and carefully managing dynamic allocation can help.
You should also monitor memory growth when your application is running for long periods of time. Memory profiling can be very useful if your performance is gradually dropping. Understanding how your memory usage changes based on your workload can help improve reliability.
Memory Constrained Environments
Applications running in memory constrained environments should make the most of the available resources. Embedded systems, light weight servers and small computing devices may not have much RAM available. You should avoid unnecessary allocations, keep your data structures small and free up temporary memory. If your application has predictable requirements then static allocation could help.
However you should carefully plan this as allocating too much memory can waste your limited resources. Using monitoring tools and profiling can help you to see if your application is using memory efficiently. Understanding how virtual memory relates to physical memory is very important. If you are heavily using swap space then this can cause performance issues in environments with little storage and processing power.
Best Practice
By implementing good Memory Management practices you can improve the reliability and performance of your application. Always ensure you are checking the return values of your allocation functions. Free any dynamically allocated memory when it is no longer required. Do not access pointers once the memory has been freed. Allocate large data structures based on what you actually require.
Reuse buffers to reduce unnecessary allocation. During development use profiling and debugging tools. Monitor how your application is behaving with realistic workloads. Memory usage can change drastically depending on how many users/requests/records are being processed. By consistently testing and measuring you can ensure you are making the right choices when optimising.
Conclusion
Understanding Memory Management on UNIX will allow your application to allocate, access, share and protect memory efficiently. Understanding concepts such as virtual address spaces, stack/heap allocation, pointers, memory mapping, shared memory, page faults and memory protection can help you identify memory leaks, excessive resource usage and improve performance by using efficient allocation methods.
Using tools such as Valgrind, AddressSanitizer, Massif, Top and Vmstat can help you to investigate any memory issues. Whatever type of application you are developing (database, large scale data processing, performance sensitive or memory constrained) using efficient Memory Management will help you create reliable, efficient and scalable UNIX applications.