Introduction
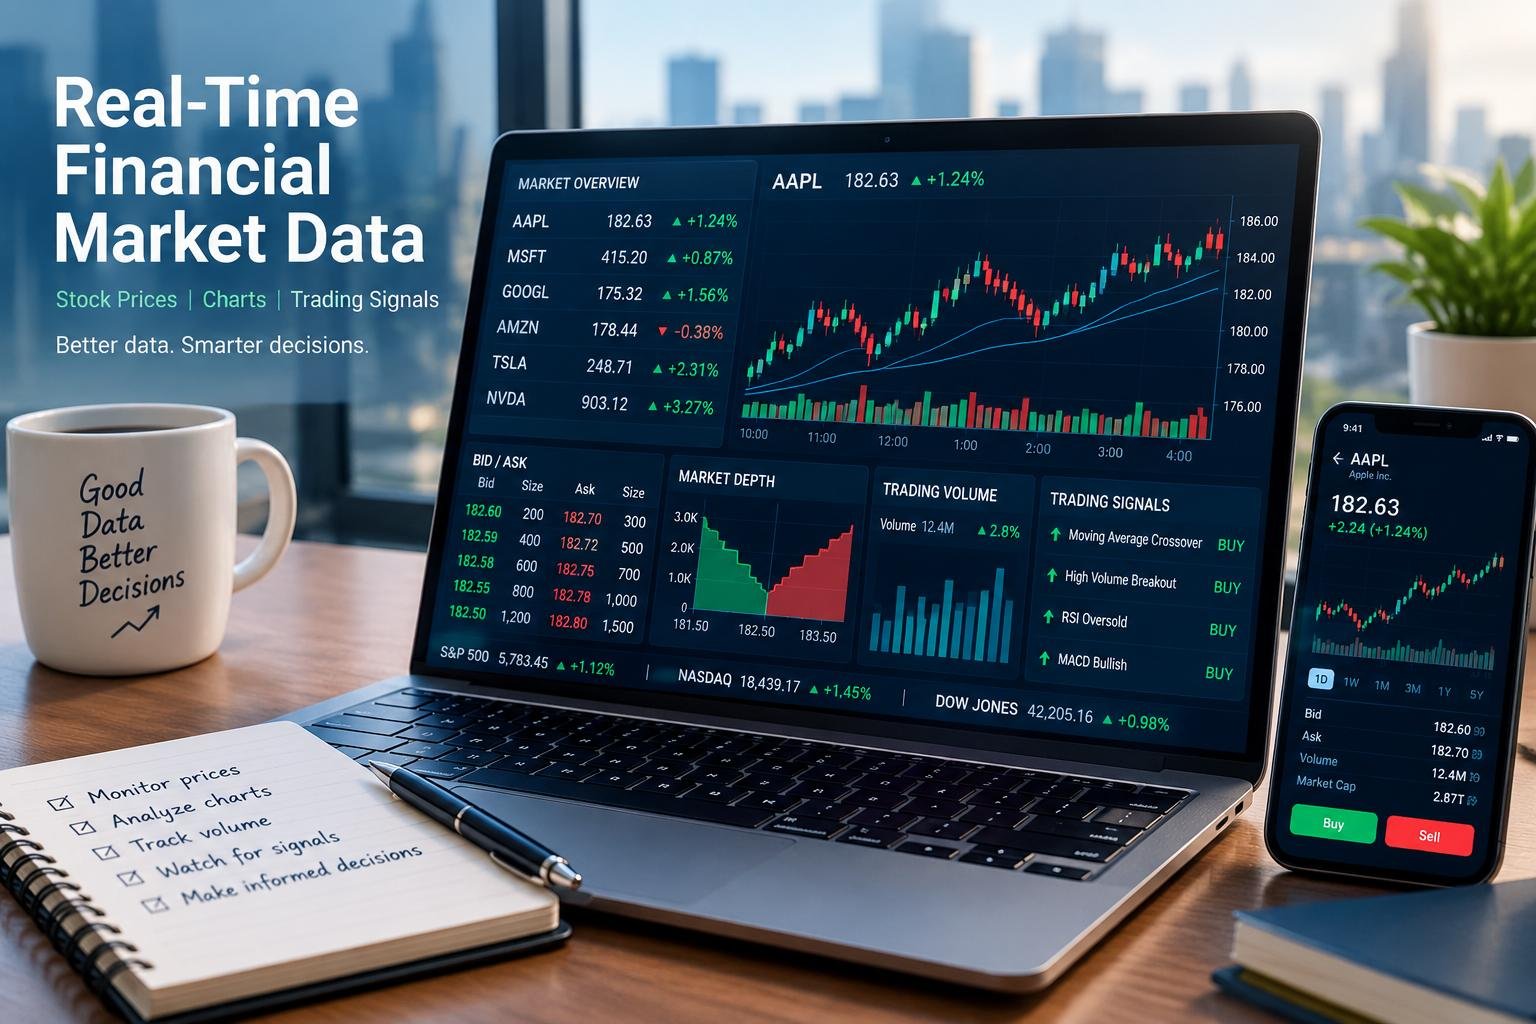
The accuracy and timeliness of information is critical in financial markets, as it enables investors to better comprehend price changes, assess opportunities, and make well-informed trading choices. All the movements of stock prices on any trading screen are the result of data that has been gathered, analyzed and disseminated via interwoven financial systems. These are used to link stock exchanges, brokers, market data vendors, investment applications and financial news services together. Firms that operate online brokerage platforms today make use of this data to show quotations, interactive charts, trading volume and analytical tools which enable users to monitor financial instruments. The information on platforms isn’t always exactly the same, though, due to varied data sources, update schedules, subscription costs and calculation techniques. Knowing how the market data is conveyed from the exchange to the investor’s screen provides explanation as to the source of the financial prices, the delays that can occur and the impact of data quality on investment research and investing.
Financial Data: Information Available in the Financial Market.
Financial market data are the statistics that provide information on the prices, trading volume, supply, and previous activity of financial assets like equities, bonds, currencies, and exchange-traded funds. It contains the current bid and ask prices, transaction prices (upon completion), volume of trading, market depth, and historical quotations. Much of this information is created during the execution of transactions during the exchanges when traders place orders. Electronic trading systems gather and transmit the information to approved users such as financial institutions, data vendors and brokers. Some offer to include exchange information along with corporate news, economic data, and other financial data, to provide a comprehensive view of market conditions. The various types of data are analyzed by investors to help them understand the market, to make comparisons, to determine price trends and to assess potential risks before investing.
How Stock Prices are Collected and Distributed
Data Collection at Financial Exchanges
The exchanges use electronic systems to accept both the buy and sell orders, arrange them in some manner according to market regulations and connect a compatible buy and sell order. When a transaction takes place, the exchange adds information about the security that was traded, the price at which it was traded, the number of shares and when the transaction was made. It also keeps track of the information of any outstanding orders, such as the prices that the participants are willing to pay or accept. This information is made available via market data feeds, which are formatted electronic messages that carry price and transaction updates and order books. These messages can be sent during the entire trading session, to enable the updating of the records of connected systems as market conditions evolve. The exchange’s infrastructure, the information feed type and the data product(s) available to each recipient affect the speed and fullness of the information.
Processing and Distribution through Data Vendors
Market data vendors gather information from exchanges and other sources, sort it and sell it to financial institutions, companies and retail investors. They can offer customers information from several exchanges, normalize security identifiers, fix some inconsistencies and keep historical data records for analysis. There are those who provide all the market information in one place, and there are those who concentrate on one or specific exchanges, asset classes, or analysis products. Once a broker receives a feed it can be processed by the brokerage systems and then offered to customers. News companies, such as financial media, also use market data to create stock tables, price updates and market reports. This means that the numbers that are presented to users may vary based on the original source, processing techniques used by the provider and the type of service used.
Comprehend the Bid Prices, Ask Prices, and Trading Volume.
Bid and Ask Prices
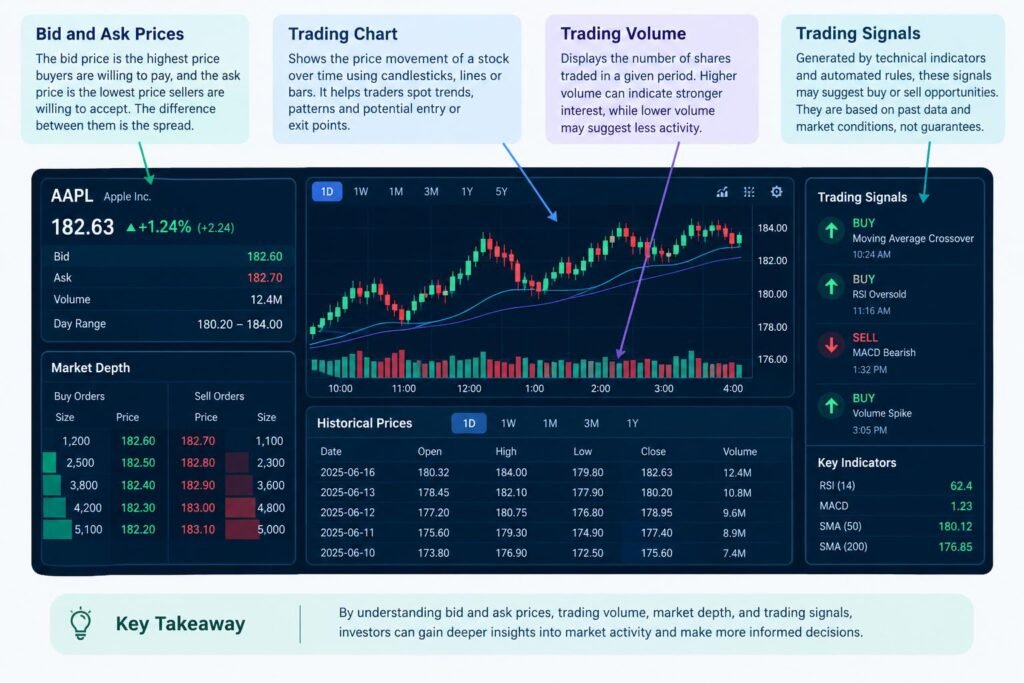
The bid price is the highest price that current buyers are willing to pay for a security and the ask price is the lowest price that current sellers are willing to accept for a security. These prices are called the bid ask spread. For example, if a stock has a bid price of $49.90 and an ask price of $50.00, the spread is $0.10. A market order to buy can be filled against a sell order that is in the queue at the ask price, and a market order to sell can be filled against a buy order at the bid price. Realized transaction costs may vary if market conditions vary or there is not enough liquidity in the market. The spread can be helpful for traders to understand the cost of trading and liquidity in the market, but it can also increase during periods of high volatility or low trading volumes.
Trading Volume and Market Depth
The amount of a security that is traded over a given time period is called its trading volume. If volume is higher, it may mean that more people are playing in the market, and if it’s lower than usual, then fewer people are playing in the market. But as with everything else in the financial world, the volume of movement does not indicate if it’s a price movement that can continue or if investors are overbidding or under-selling any given price change because everyone who makes a trade has a buyer to sell to and a seller to buy from. Market depth gives more information by displaying the offerings to buy or sell at various prices. A market depth screen can show that there is a huge accumulation of people willing to buy at lower prices and/or a huge accumulation of people willing to sell at higher prices. The information enables traders to gauge liquidity and how significant trades might impact prices. However, “displayed” orders are not necessarily orders that will be executed and may be cancelled at any time, depending upon the market’s perception of its intentions.
Real-Time and Delayed Stock Quotes.
Real-time quotations are supplied with a processing delay that is as low as possible compared to the activity of the underlying market; however, this delay varies according to the feed and delivery infrastructure. Delayed quotes are quotes that are intentionally quoted after a specified number of minutes, typically about 15 for some exchange data services. Real-time data is crucial for traders who are active and need up-to-the-minute updates for placing trades or keeping a close watch on the markets. For long-term investors, the timeliness of the data might not be an issue if their investment strategy involves evaluating trends over time, conducting a company research, or tracking portfolio performance. Real-time information could be given on a paid subscription basis, on exchange-specific permission, or professional data agreement. A platform that shows a current-looking price does not always mean that it gives a real-time quotation as the user should always verify the time stamp, the state of the market and the disclosure of data before using the information to make decisions when it is important.
Financial Charts and Trading Signals
Financial charts are visualizations that interpret the input data from the market and enable the user to recognize patterns and to contrast the price developments over time. Selected prices are often plotted on line charts and opening, highest, lowest and closing prices are summarized on candlestick charts for a specific interval. Every candlestick is a fixed time frame, like a minute, an hour or a trading day. These displays are created by charting systems based on either a list of transactions or a list of price action observations. They then form the information into the intervals that are set. Stock splits and other events may cause adjustments to historical chart data, based on methodology. Trading signals are triggered when analytical rules detect that conditions have changed, like moving averages cross over each other, unusual volume or momentum changes have occurred. These signals can inform research, but do not necessarily predict future performance since signals rely on past inputs, assumptions and the effects of market conditions.
The Importance of APIs, Cloud Infrastructure and Analytics
APIs, or application programming interfaces, enable software programs to communicate with each other in a structured manner, sharing financial data. An API can be used to access a brokerage application, such as to request quotations, get historical prices, obtain company information, or provide market updates to a charting application. Data can be sent with a repeated request or continuous data stream. These activities are enabled through cloud infrastructure, which includes computing power, storage, data networks and elasticity. Cloud systems can be used to handle big amounts of incoming data and provide support for a number of users from various locations. The data is then fed through analytics systems to derive indicators, make comparisons, spot abnormal movements and enable automatic strategies. The quality of the resulting analysis will, however, rely on the accuracy of the source data, correct time stamping, reliability of the processing used and careful management of missing and inconsistent observations.
Why Market Data Differs
Prices may vary across the different financial platforms as they may not receive the same feeds or they may be using a different type of quotation. There is a possibility that one can provide the latest completed trade and the other can provide the current bid or ask price. Some of the platforms offer info based on just one exchange, while others merge info from several exchanges. Other discrepancies can occur due to late subscription, update frequency, currency conversion, adjusted historical prices, and weekends and weekdays. If prices change quickly, it’s possible that screens might show different numbers at the same time, due to a small delay in the transmission or processing of the price. It is thus advisable for investors who check quotations to verify the security identifier, exchange, time and date, currency, and whether a stated price is a trade price, bid price, ask price or consolidated price.
The Importance of Data Quality, Latency, and Investment Decisions
Data quality is the reliability of the information in the market, its accuracy, completeness and consistency. Whether the result is incorrect timestamps, a missing transaction, or duplicated records or prices, charts can be skewed and analytical outcomes are impossible to get right. The time it takes for information to move from one source to the other and to the end user is called latency. Reducing latency is critical for approaches that respond to small price fluctuations, but doesn’t guarantee an improved investment decision. The investors should also have the right risk management, market analysis, and market conditions. When using a chart or trading signal, the user should take into account the information source, frequency of information updating, adjustments to the past, and the limitations of the information analysis method. Discerning differences between information from trustworthy sources can be helpful to identify discrepancies, and being aware that not all differences are necessarily errors.
Conclusion
Real-time financial data allows investors to access the prices, charts, and analysis tools they need on a daily basis and link them to the exchanges where they trade. Orders and transactions are recorded in exchanges, data vendors provide data, and brokerage platforms provide APIs, computing infrastructure and analytics to provide access. Each of the bid and ask price, volume of trading, market depth, trading history, and trading signals provides a different insight into market activity. However, the differences in the data source, the type of quotation, subscriptions, as well as latencies can make a difference whether those users will see it or not. Knowing these differences means that investors can then pay attention to the information in the market with a greater degree of scrutiny, and not take every price they see as the same or every trading signal as a valid indicator. The ability to receive information quickly and being able to use it effectively is, however, not just about the time it takes, but also about knowing the source, the quality, the limitations and the relevance of the information for the investment decision under consideration.
Get more well researched information about Real-Time Financial Market Data here.