The Market Share Matrix by Boston Consulting Group
The
Boston Consulting Group Market-Share Matrix is a portfolio planning model
developed by Bruce Henderson of the Boston Consulting Group in the early
1970’s. It is based on the observation that a company’s business units can be
classified into four categories based on combinations of market growth and
market share relative to the largest competitor. Market growth serves as a
proxy for industry attractiveness, and relative market share serves as a proxy
for competitive advantage. The growth-share matrix thus maps the business unit
positions within these two important determinants of profitability.
This framework assumes that an increase in relative
market share will result in an increase in the generation of cash. This
assumption often is true because of the experience curve; increased relative
market share implies that the firm is moving forward on the experience curve
relative to its competitors, thus developing a cost advantage. A second
assumption is that a growing market requires investment in assets to increase
capacity and therefore results in the consumption of cash. Thus the position of
a business on the growth-share matrix provides an indication of its cash
generation and its cash consumption.
Henderson
reasoned that the cash required by rapidly growing business units could be
obtained from the firm’s other business units that were at a more mature stage
and generating significant cash. By investing to become the market share leader
in a rapidly growing market, the business unit could move along the experience
curve and develop a cost advantage. From this reasoning, the Boston Consulting
Group Market-Share Matrix was born.
The
four categories are:
four categories are:
·
Dogs – Dogs have low market share and a low growth rate
and thus neither generate nor consume a large amount of cash. However, dogs are
cash traps because of the money tied up in a business that has little
potential. Such businesses are candidates for divestiture.
Dogs – Dogs have low market share and a low growth rate
and thus neither generate nor consume a large amount of cash. However, dogs are
cash traps because of the money tied up in a business that has little
potential. Such businesses are candidates for divestiture.
·
Question marks – Question marks are
growing rapidly and thus consume large amounts of cash, but because they have
low market shares they do not generate much cash. The result is a large net
cash consumption. A question mark (also known as a “problem child”)
has the potential to gain market share and become a star, and eventually a cash
cow when the market growth slows. If the question mark does not succeed in
becoming the market leader, then after perhaps years of cash consumption it
will degenerate into a dog when the market growth declines. Question marks must
be analyzed carefully in order to determine whether they are worth the
investment required to grow market share.
·
Stars – Stars generate large amounts of cash because of
their strong relative market share, but also consume large amounts of cash
because of their high growth rate; therefore the cash in each direction
approximately nets out. If a star can maintain its large market share, it will
become a cash cow when the market growth rate declines. The portfolio of a
diversified company always should have stars that will become the next cash
cows and ensure future cash generation.
·
Cash cows – As leaders in a mature market, cash cows exhibit
a return on assets that is greater than the market growth rate, and thus
generate more cash than they consume. Such business units should be
“milked”, extracting the profits and investing as little cash as
possible. Cash cows provide the cash required to turn question marks into
market leaders, to cover the administrative costs of the company, to fund
research and development, to service the corporate debt, and to pay dividends
to shareholders. Because the cash cow generates a relatively stable cash flow,
its value can be determined with reasonable accuracy by calculating the present
value of its cash stream using a discounted cash flow analysis.
Under the market-share matrix model, as an industry
matures and its growth rate declines, a business unit will become either a cash
cow or a dog, determined solely by whether it had become the market leader
during the period of high growth. While originally developed as a model for
resource allocation among the various business units in a corporation, the
market-share matrix also can be used for resource allocation among products
within a single business unit. Its simplicity is its strength – the relative
positions of the firm’s entire business portfolio can be displayed in a single
diagram.
Application of the Boston
Consulting Group Conceptual Framework
Consulting Group Conceptual Framework
A company that must succeed should be able to
manage its portfolio of products or strategic business units in order to
balance cash flows. Stars generate enough cash to sustain themselves. Cash cows
generate cash flows to be milked. Question marks suck up cash from cash cows. Dogs
are cash traps that should be dispensed with if they are eating too much and
contributing nothing.
In all of
this, the field theory should be applied. The field theory has it that, a
company might decide on its economies of scope. It must decide on what product
line area it wants to compete in and what skills will be needed to successfully
compete in that area. Four variables are to be considered, they are:
1. products to be offered
2. the markets to be serve
3. the customer to satisfy, and
4. The value to be added.
Benefits Of The Boston Consulting
Framework To Business Managers
Framework To Business Managers
The market share matrix as a strategic planning
tool has made a significant contribution to strategic management and continues
to be an important strategic tool used by companies today. The matrix provides
a composite picture of the strategic position of each separate business within
a company so that the management can determine the strengths and the needs of
all sectors of the firm. The development of the matrix requires the assessment
of a business portfolio, which includes an organization’s autonomous divisions
(activities, or profit centres).
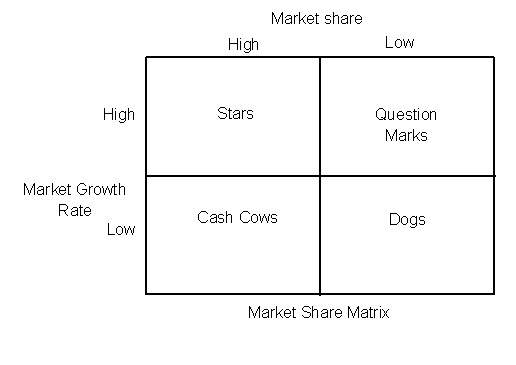
The
market share matrix presents graphically the differences among these business
units in terms of relative market share and industry growth rate. The vertical
axis represents in a linear scale the growth rate of the market in which the
business exists (as shown in the diagram above). This is generally viewed as
the expected growth rate for the next five years of the market in which a
particular business competes. The values of the vertical axis are the relevant
market growth rates (i.e., 5 percent, 10 percent, 15 percent, 20 percent,
etc.). Usually a 10 percent cut-off level is selected in order to distinguish
high from low market growth rate (a 10 percent value corresponds to doubling
current experience in the next five to seven years).
The
horizontal axis represents in a logarithmic scale the market share of a
business within a firm relative to the market share of the largest competitor
in the market. For example, Company A may have a 10 percent market share and
Company B, the leading competitor, holds 40 percent of the market. Company A’s
market share relative to Company B’s market share is 25 percent, or .25×. If
Company A has a 40 percent share and Company B has a 10 percent share, Company
A’s market share is 400 percent, or 4.0×.
Relative market share is an
indicator of organizations competitive position within the industry, and
underlies the concept of experience curve. Thus, business organizations with
high relative market share tend to have a cost leadership position.
indicator of organizations competitive position within the industry, and
underlies the concept of experience curve. Thus, business organizations with
high relative market share tend to have a cost leadership position.
Each of a
company’s products or business units is plotted on the matrix and classified as
one of four types: question marks, stars, cash cows, and dogs. Question marks,
located in the upper-right quadrant, have low relative market share in a
high-growth market. These businesses are appropriately called question marks
because it is often uncertain what will happen to them.
Careful
examination by management can help determine how many resources (if any) should
be invested in these businesses. If significant change can increase relative
market share for a question mark, it can become a star and eventually gain
cash-cow status. If relative market share cannot be increased, the question
mark becomes a dog.
The
upper-left quadrant contains stars, businesses with high relative market share
in high-growth markets. These businesses are very important to the company
because they generate a high level of sales and are quite profitable. However,
because they are in a high growth market that is very attractive to
competitors, they require a lot of resources and investments to maintain a high
market share. Often the cash generated by stars must be reinvested in the
products in order to maintain market share.
When the
market growth slows down, stars can take different paths, depending on their
abilities to hold (or gain) market share or to lose market share. If a star
holds or gains market share when the growth rate slows, stars become more
valuable over time, or cash cows. However, if a star loses market share, it
becomes a dog and has significantly less value (if any) to the company.
The
lower-left quadrant contains businesses that have high relative market share in
low-growth markets. These businesses are called cash cows and are highly
profitable leaders in their industries. The funds received from cash cows are
often used to help other businesses within the company, to allow the company to
purchase other businesses, or to return dividends to stockholders.
Dogs
generate low relative market share in a low-growth market. They generate little
cash and frequently result in losses. Management should carefully consider
their reasons for maintaining dogs. If there is a loyal consumer group to which
these businesses appeal, and if the businesses yield relatively consistent cash
that can cover their expenses, management may choose to continue their
existence. However, if a dog consumes more resources than it’s worth, it will
likely be deleted or divested.
Strategic
business units, which are often used to describe the products grouping or
activities, are represented with a circle in the market share matrix. The size
of the circle indicates the relative significance of each business unit to the
organization in terms of revenue generated (or assets used).
business units, which are often used to describe the products grouping or
activities, are represented with a circle in the market share matrix. The size
of the circle indicates the relative significance of each business unit to the
organization in terms of revenue generated (or assets used).
One big
advantage of the matrix is its ability to provide a comprehensive snapshot of
the positions of a company’s various business concerns. Furthermore, an
important benefit of the market share matrix is that is draws attention to the
cash flow, investment characteristics, and needs of an organization’s business
units, helping organizations to maintain a balanced portfolio.
Unfortunately,
the market share matrix, like all analytical techniques, also has some
important limitations. It has been criticized for being too simplistic in its
use of growth rate and market share. Market growth rate is only one variable in
market attractiveness and market share is only one variable in a business’s
competitive position. Furthermore, viewing every business as a star, cash flow,
dog, or question mark is not always realistic. A four-cell matrix is too simple
because strategic competitive positions are more complicated than
“high” and “low”.
Another
disadvantage of using the market share matrix is that it is often difficult for
a company to sufficiently divide its business units or product lines.
Consequently, it is difficult to determine market share for the various units
of concern.
disadvantage of using the market share matrix is that it is often difficult for
a company to sufficiently divide its business units or product lines.
Consequently, it is difficult to determine market share for the various units
of concern.
Limitations
of Market Share Matrix By Boston Consulting
The
market-share matrix once was used widely, but has since faded from popularity
as more comprehensive models have been developed. Some of its weaknesses are:
market-share matrix once was used widely, but has since faded from popularity
as more comprehensive models have been developed. Some of its weaknesses are:
·
Market growth rate is only one factor in industry attractiveness,
and relative market share is only one factor in competitive advantage. The
market-share matrix overlooks many other factors in these two important
determinants of profitability.
Market growth rate is only one factor in industry attractiveness,
and relative market share is only one factor in competitive advantage. The
market-share matrix overlooks many other factors in these two important
determinants of profitability.
·
The framework assumes that each business unit is
independent of the others. In some cases, a business unit that is a
“dog” may be helping other business units gain a competitive
advantage.
The framework assumes that each business unit is
independent of the others. In some cases, a business unit that is a
“dog” may be helping other business units gain a competitive
advantage.
·
The matrix depends heavily upon the breadth of the
definition of the market. A business unit may dominate its small niche, but have
very low market share in the overall industry. In such a case, the definition
of the market can make the difference between a dog and a cash cow.
The matrix depends heavily upon the breadth of the
definition of the market. A business unit may dominate its small niche, but have
very low market share in the overall industry. In such a case, the definition
of the market can make the difference between a dog and a cash cow.
References
Boston Consulting Group (2009). Growth-Share
Matrix. Retrieved from http://www.business-tools-templates.com on 16th
June, 2015.
Matrix. Retrieved from http://www.business-tools-templates.com on 16th
June, 2015.
Costin, H. (1998). Readings in Strategy and
Strategic Planning. Fort Worth, TX: The Dryden Press.
Strategic Planning. Fort Worth, TX: The Dryden Press.
David, R. F. (2003). Strategic Management:
Concepts and Cases. Upper Saddle River, NJ: Prentice Hall.
Concepts and Cases. Upper Saddle River, NJ: Prentice Hall.
Houlden, B. (1996). Understanding Company
Strategy: An Introduction to Analysis and Implementation. Cambridge, MA:
Blackwell Publishers, Inc.
Strategy: An Introduction to Analysis and Implementation. Cambridge, MA:
Blackwell Publishers, Inc.
Hunger, J. D. and Thomas L. W. (1997). Essentials
of Strategic Management. Reading, MA: Addison Wesley.
of Strategic Management. Reading, MA: Addison Wesley.
Porter, M.E. (1980). Competitive Strategy. New
York, NY: The Free Press.
York, NY: The Free Press.
Stahl, J. and David W. (1992). Strategic
Management for Decision Making. Massachusetts: PWS-KENT Publishing.
Management for Decision Making. Massachusetts: PWS-KENT Publishing.
Umale, A.A. (2014). Basic Entrepreneurship:
Theory, Management and Practice. Ughelli: Masco Graphics.
Theory, Management and Practice. Ughelli: Masco Graphics.
Wheelen, L. and David J. (1998). Strategic
Management and Business Policy: Entering 21st Century Global Society. Reading,
MA: Addison Wesley.
Management and Business Policy: Entering 21st Century Global Society. Reading,
MA: Addison Wesley.