It deals with the analysis
and presentation of data. However, the tools used to obtain this data was
questionnaire with 19 questions drawn for the purpose of gathering information
from the respondents. A total of 100 questionnaire were distributed 100
retrieved and responses were quantified by which judgement was made. The whole
questionnaire retrieved was use in the analysis of the study. The data
generated for this study were subjected to statistical analysis in order to
test the research questions formulated for this study, results and conclusion
were drawn. To arrive at the percentage the following formula was used.
X x 100
Y 1
Where x is the number of
frequency and y is the total.
frequency and y is the total.
In respect of this, the
analysis of data is shown respectively. The tables and a bar chart shown below.
analysis of data is shown respectively. The tables and a bar chart shown below.
DATA ANALYSIS
TABLE 1: Distribution According to Age
|
Age
|
Respondent
|
Frequency
|
Percentage
|
|
1
|
24 – 29years
|
30
|
30%
|
|
2
|
30 – 34years
|
40
|
40%
|
|
3
|
35 – 39years
|
20
|
20%
|
|
4
|
40 – 45years
|
10
|
10%
|
|
Total
|
100
|
100%
|
|
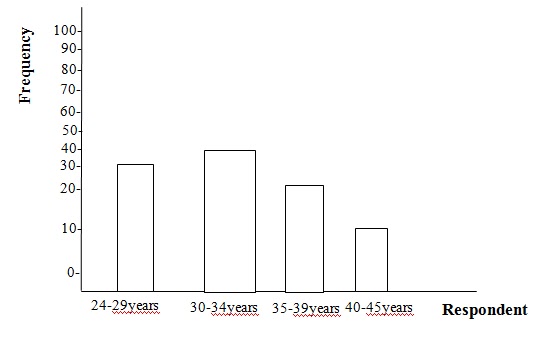
Table 2: Distribution according to gender
|
Respondent
|
Frequency
|
Percentage
|
|
Female
|
60
|
60%
|
|
Male
|
40
|
40%
|
|
Total
|
100
|
100%
|

TABLE 3: Distribution according to religion
|
Respondent
|
Frequency
|
Percentage
|
|
Christian
|
78
|
78%
|
|
Islam
|
10
|
10%
|
|
Others
|
12
|
12%
|
|
Total
|
100
|
100%
|

Table 4: What is your
Genotype
Genotype
|
Respondent
|
Frequency
|
Percentage
|
|
SS
|
10
|
10%
|
|
AA
|
70
|
70%
|
|
AS
|
20
|
20%
|
|
Total
|
100
|
100%
|

Table 5: Have you heard of sickle cell disease before?
|
Respondent
|
Frequency
|
Percentage
|
|
Yes
|
75
|
75%
|
|
No
|
25
|
25%
|
|
Total
|
100
|
100%
|

Table 6: If yes what does sickle cell disease mean?
|
Option
|
No. of Respondent
|
Percentage
|
|
A condition caused by
viral micro organism |
10
|
10%
|
|
A spiritual condition that
is sent upon his/her blood by the gods |
5
|
5%
|
|
A disease of the blood
which affects the blood cell due to marriage of both AS parent |
70
|
70%
|
|
A disease that
metabolizes tissue and cell of the body |
15
|
15%
|
|
Total
|
100
|
100%
|

Table 7: Did you and your partner know or did genotype test before
getting married
getting married
|
Respondent
|
Frequency
|
Percentage
|
|
Yes
|
80
|
80%
|
|
No
|
20
|
20%
|
|
Total
|
100
|
100%
|
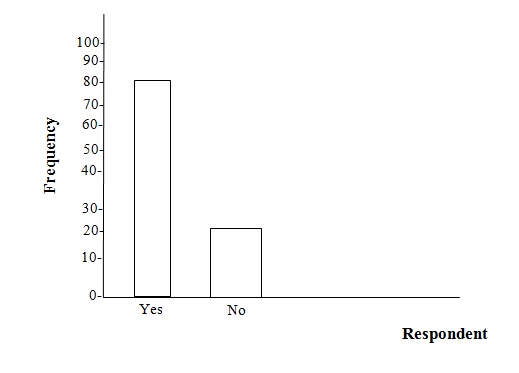
Table 8: How did you know your genotype?
|
Options
|
No. of Respondent
|
Percentage
|
|
Through marriage counselling
|
45
|
45%
|
|
Through hospitalization
|
15
|
15%
|
|
Through routine medical
checkup |
25
|
25%
|
|
Through a relation
|
10
|
10%
|
|
Others
|
5
|
5%
|
|
Total
|
100
|
100%
|
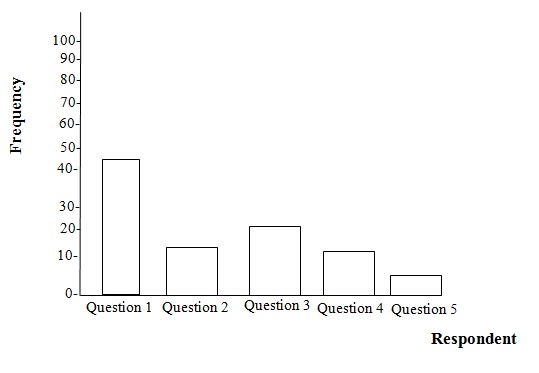
Table 9: Do you have children that are of age or matured for marriage?
|
Respondent
|
Frequency
|
Percentage
|
|
Yes
|
25
|
25%
|
|
No
|
75
|
75%
|
|
Total
|
100
|
100%
|
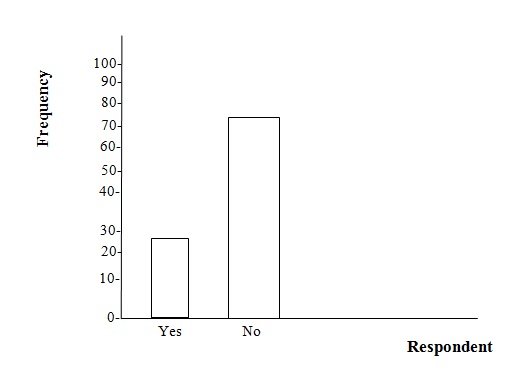
Table 10: If yes do they have knowledge of
sickle cell disease and the need for genotype testing before marriage
sickle cell disease and the need for genotype testing before marriage
|
Respondent
|
Frequency
|
Percentage
|
|
Yes
|
25
|
25%
|
|
No
|
75
|
75%
|
|
Total
|
100
|
100%
|

Table 11: Can sickle cell disease be presented?
|
Respondent
|
Frequency
|
Percentage
|
|
Yes
|
72
|
72%
|
|
No
|
28
|
28%
|
|
Total
|
100
|
100%
|

Table 12: If yes how can it be prevented?
|
Options
|
No. of Respondent
|
Percentage
|
|
Environmental and
personal hygiene |
15
|
15%
|
|
Going for blood screening
before marriage |
50
|
50%
|
|
Adequate diet intake
|
10
|
10%
|
|
Not marrying a carrier or
individual with the disease |
25
|
25%
|
|
Total
|
100
|
100%
|

Table 13: Do children with sickle cell disease
go to school in your area?
go to school in your area?
|
Respondent
|
Frequency
|
Percentage
|
|
Yes
|
80
|
80%
|
|
No
|
20
|
20%
|
|
Total
|
100
|
100%
|
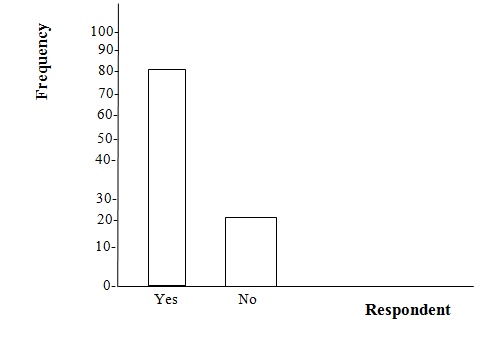
Table 14: If no, why are
they not given the chance for education
they not given the chance for education
|
Details
|
No. of Respondent
|
Percentage
|
|
Because of frequent ailment
|
25
|
25%
|
|
Because of frequent relapses
|
15
|
15%
|
|
People see them as fragile
|
20
|
20%
|
|
No response
|
40
|
40%
|
|
Total
|
100
|
100%
|
Table 15: Which are the
right combination of genotype for intending couples? (i) AA and AS (ii) AA and
SS (iii) AA and AA (iv) AS and AS (v) SS and AS (vi) SS and SS
right combination of genotype for intending couples? (i) AA and AS (ii) AA and
SS (iii) AA and AA (iv) AS and AS (v) SS and AS (vi) SS and SS
|
Options
|
Respondent
|
Percentage
|
|
a. i, ii, and v
|
10
|
10%
|
|
b. i, ii and iii
|
72
|
72%
|
|
c. i, iv and v
|
18
|
18%
|
|
Total
|
100
|
100%
|

Table 16: Through what
medium did you get to know about sickle cell disease?
medium did you get to know about sickle cell disease?
|
Option
|
Frequency
|
Percentage
|
|
Through education programme
|
25
|
25%
|
|
Prints and electronic media
|
10
|
10%
|
|
Through parents
|
15
|
15%
|
|
Schools
|
45
|
45%
|
|
Others
|
5
|
5%
|
|
Total
|
100
|
100%
|
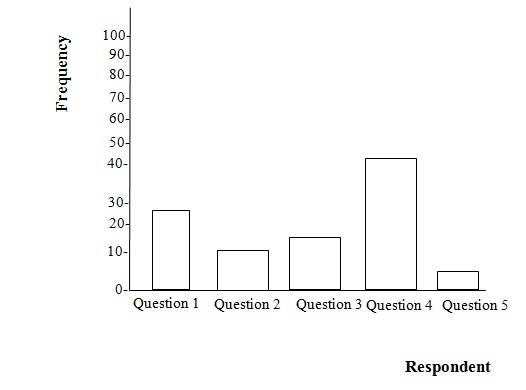
Table 17: Are the media for
increasing knowledge of sickle cell disease still available in Ozoro Community?
increasing knowledge of sickle cell disease still available in Ozoro Community?
|
Respondent
|
Frequency
|
Percentage
|
|
Yes
|
84
|
84%
|
|
No
|
16
|
16%
|
|
Total
|
100
|
100%
|

Table 18: Does your
culture/religion belief permit blood screening for genotype in early stage of
life and before marriage?
culture/religion belief permit blood screening for genotype in early stage of
life and before marriage?
|
Respondent
|
Frequency
|
Percentage
|
|
Yes
|
88
|
88%
|
|
No
|
12
|
12%
|
|
Total
|
100
|
100%
|