
Introduction
UNIX/Linux are operating systems used by many applications. Despite being stable and reliable, applications can suffer performance issues. To find out what is causing these issues, system programmers can make use of tools like GDB, strace, performance tools and memory analysers.
Using debugging with GDB will help developers to see how their program is running and any errors that could be present. With the use of performance tools, we can easily find out what is causing our issues and ensure that our system runs reliably.
UNIX Performance Tools and Debugging
Performance tools will allow us to see how our application and operating system are using available resources. This includes CPU, RAM, storage, network and system calls. This will give us an indication if our system is running normally or if there are issues occurring that could impact our application. Our application could be running slowly due to high CPU usage, waiting for storage or high memory contention. By using performance tools, we can quickly find out what is happening and improve our application.
Debugging will allow us to find errors within our application and fix them. This can include segmentation faults, unexpected program termination, incorrect calculations, memory issues and external resource issues. Debugging will help us to understand why an issue is occurring and performance tools can be closely linked. An application could be suffering performance issues without any visible errors occurring. A program could also be running fine however when large amounts of data are processed or multiple requests are made, it could cause the program to fail. By using performance tools and debugging, we will have a better understanding of how our application is behaving.
Debugging UNIX Applications with GDB

GDB (GNU Debugger) is an important tool to use when debugging programs written in C/C++ or other languages. It allows us to see how our application is running, view variables, analyse memory addresses and find any errors.
It can be very useful when an application is crashing or returning unexpected results. We can add breakpoints to our application so that we can pause the program at certain points. This means that we can look at our application and see what is going on inside.
Breakpoints
Breakpoints can be added to our application so that we can pause it at certain points, for example inside a function or on a specific line of code. This means we can view our variables, function arguments and ensure our application is running as expected. If we have an issue with incorrect calculations, we could add a breakpoint to the function carrying out the calculation. When we reach this point, we can use GDB to view what is being passed into our function.
Some common commands are:
GDB ./application
break main
run
next
step
print variable_name
continue
The break command adds a breakpoint. The run command will run our application. The next command will run the next line of code in our source file without stepping into functions. The step command will step into a function. The print command will show us the value of our variable. The continue command will continue running our application until another breakpoint or event occurs.
Crash Investigation
One of the most useful things we can do with GDB is investigate application crashes. If our program crashes we can use GDB to look at our core dump file. This will only be created if the operating system is set up to do so. The core dump will show us information about our process at the point of failure including memory. We can open this file using GDB and use the bt command to view our call stack. This will tell us which functions were running at the point of failure.
Example:
GDB ./application core
bt
If we see that a function is being used to access memory, we can check if our application is using an invalid pointer or if we are trying to access an object that has been released. Just because a specific function is showing in the call stack does not mean this is where the original error is. Take a look at the functions around this, variables and how the program is running to decide how to fix the issue. Core dumps are very useful to help us investigate issues that have occurred in production.
System Call Investigation with strace
System calls are how our application interacts with the kernel of the operating system. Our application may need to make requests to the kernel when we are opening files, reading data, creating processes or using network sockets. We can use the strace tool to see what system calls are being used.
This can be very useful to investigate unexpected behaviours, permission issues, inefficiencies and processes that seem to freeze. Unlike debugging our source code, this tool will show us how our application is interacting with the operating system.
Viewing System Calls
We can use strace to view the system calls being used when our application starts or at a specific point. For example:
strace ./application
This will show us the system calls being used, including arguments and return values. An example of the output could look like:
openat(AT_FDCWD, “/etc/config.conf”, O_RDONLY) = -1 EACCES
read(3, “configuration data”, 18) = 18
close(3) = 0
In the first line we can see that our application tried to open a config file, however it returned an EACCES error meaning there was a permission issue. This means our application may not have the correct permissions. The rest of the output shows that we were able to read and close another file descriptor. This will help us to see if the issue is with our application or the operating system. This can be very useful if our application is running fine on our development machine but failing in production.
Investigate High System Call Usage
If we have too many system calls being used, this can cause our application to run slower. For example, if we are reading from a file one byte at a TIME, we could be making thousands of unnecessary reads. We can use strace to see if the application is making too many system calls. This could be shown by seeing that it keeps calling functions like read(), write() and openat(). This can help us to see if our application is doing something unnecessary and we could make it more efficient by adding batching.
Strace can also be used to investigate any blocking calls. A blocking call is when our process needs to WAIT for something to happen externally. This could include waiting for data from a network socket, reading from a pipe or accessing something that isn’t instantly available. We can use commands like strace -p PID to attach to a process. If our process keeps waiting on something, this could show us where our application is waiting. Although we should take into consideration the logic of our application as sometimes it is expected for our application to WAIT.
Process and Resource Monitoring on UNIX
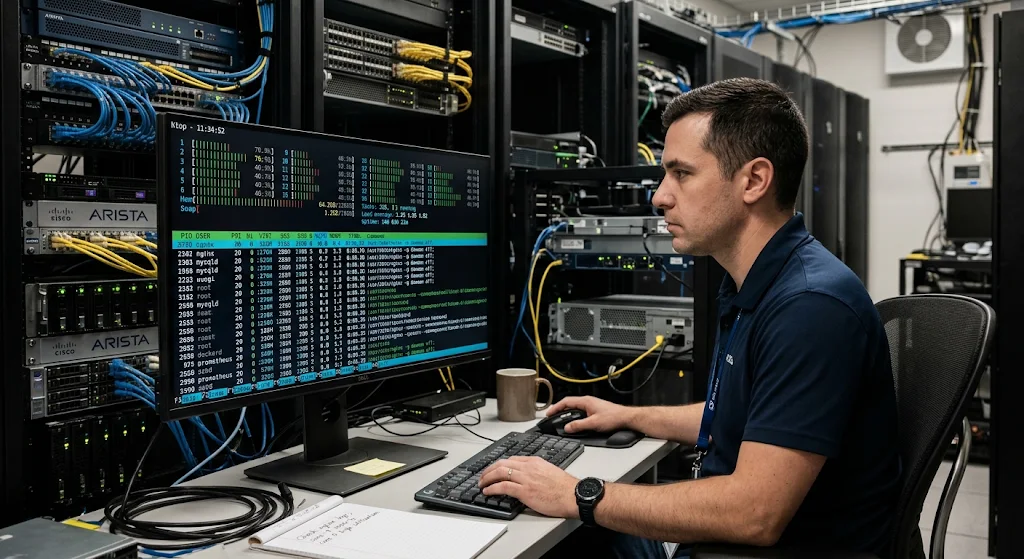
It is very important to monitor processes to understand how your application is using resources. There could be hundreds of processes running on a UNIX/Linux system and they will all be fighting for CPU, memory and other resources. If one process is using an unusual amount of resources this can impact the performance of other applications. By using monitoring tools, we can identify these processes and understand if they are running normally.
Tools like top, htop, ps and vmstat can be used to see what processes are running, what resources they are using, how much memory is available and how busy our system is. These are useful to investigate slow servers, overloaded systems and applications that seem to get slower.
Monitoring with top and htop
The top command will show us a live view of processes running on our system. This will show us CPU usage, memory usage, process IDs and statuses. This can help us to identify which applications are using too many resources.
Example:
top
The htop tool will give us an interactive view. This will allow us to look at specific processes and organise our information. If we have an application that is constantly using a large percentage of our CPU resources, we can identify the process ID and see if it is processing an unusual amount of requests or if it has inefficient calculations. This will help us to identify which processes we should investigate further.
Viewing Processes with ps and vmstat
The ps command will show us detailed information about processes running on our system. This will give us a snapshot of what is happening. We can use this to view process IDs, who owns them, if they are running and what resources they are using.
ps aux
The vmstat command will show us information about memory, processes, CPU and I/O.
vmstat 2
This will show us live stats every 2 seconds. This can help us to identify if there are too many swaps happening, high CPU usage and if processes are waiting for resources. If there are continual swaps happening this could indicate there is memory pressure. This can happen if applications are competing for limited physical memory. However, if there are only a few swaps happening then this may not be an issue. We should look at a few readings to see if we need to add more memory or optimize our application.
CPU Profiling
CPU profiling can help us to understand how our application is using CPU. A program can seem slow if it is carrying out unnecessary calculations, expensive functions multiple times or has inefficient algorithms. Without profiling, we could waste a lot of TIME optimising parts of our code that are not really impacting our performance.
Profiling tools will show us which functions are using the most CPU. This is especially important if we have applications that are processing large amounts of data, complex calculations or lots of requests.
Profiling with perf
The perf tool on Linux is a powerful Performance Analysis tool. It will give us information about what our CPU is doing and how our application is running. We can identify which functions are being used a lot.
Example:
perf record -g ./application
perf report
The first command will record performance data whilst our application is running. The second command will show us a report of our functions and how they are being used with the CPU. We can look at this to see if a specific function is using too much CPU. If we see a sorting function or repeated calculation, we can investigate to see if the algorithm is suitable for our workload or if we are doing anything unnecessary. We should be careful when interpreting profiling results as the cost may vary depending on the data, environment and workload.
Understanding CPU Issues
A CPU bottleneck is when there is more processing to do than the CPU can handle or a specific thread is doing too much calculation. Common signs of this are high CPU usage, slow application response times and lower throughput. However, high CPU usage doesn’t always mean there is an issue. If our server is doing genuine calculations it could be using most of its available CPU efficiently. We should compare the CPU readings with our application response times, workload and expected performance.
Profiling can help us to identify any inefficient loops, too many function calls, unnecessary conversions and expensive calculations that are being done too often. For example, if we have a calculation that is continually being done inside a loop we could move it outside of the loop to reduce processing overhead. We should use the profiling results to guide us and test our performance.
Memory Analysis and Memory Leak Detection
Memory management is an important part to consider when developing applications on UNIX. If we are writing in C/C++ we need to make sure we are allocating and freeing our memory.
If we don’t manage our memory well, we could have memory leaks, invalid memory access and high resource usage. A memory leak occurs when we allocate memory to our application but don’t free it. Whilst our program is running, this can build up and cause less memory to be available to other processes.
Using Valgrind
Valgrind is a popular memory analysis framework. It will help us to identify any issues with our memory management. The Memcheck tool can identify memory leaks, invalid reads, invalid writes and uninitialised values.
A common command to use is:
valgrind –leak-check=full ./application
This will show us information about our memory allocation and any potential issues. For example, it could tell us how much memory was allocated at the end of our program. It will also tell us which function allocated the memory. We can use this to find the relevant section of our code and see if the memory should have been freed sooner. Not all memory will be a serious leak as some applications will keep the memory until the end. We need to understand what is expected to be allocated.
Understanding Memory Usage on Linux
There are other tools on Linux to help us understand memory usage. The free command will show us physical memory and swap usage. The /proc/PID/status file will show us information about a specific process.
free -h
cat /proc/PID/status
The free -h command will show us memory in a human readable format. This will show us how much memory we have available, how much is being used and how much swap is being used. This can help us to identify if there is memory pressure. The status file will show us more details including virtual memory size and resident memory. We can compare this over TIME to identify if an application is continually using more memory. We should also consider how memory is being allocated and the workload of our application as increased memory usage could be genuine if we are processing more data. We should look at how the memory is behaving over TIME to give us a reliable diagnosis.
Network Diagnostics
The performance of our network can greatly impact our application. If our application relies on external services, databases, APIs or distributed systems then our program could seem slow. This is because it could be spending a lot of TIME waiting for our network.
Our network could be having issues with high latency, packet loss, DNS issues, connection issues or network resource exhaustion. To help us identify what is happening we can use tools to see what connections we have, what traffic we have and how long we are waiting. We can use tools like ss, ping, traceroute and tcpdump.
Viewing Connections with ss
The ss command will show us information about our network sockets and connections. This can be useful to see what connections we have, what services are listening and any issues with TCP/UDP.
ss -tuln
This will show us what TCP and UDP sockets we have listening to. This can help us to confirm if our application is listening on the correct port. Another useful command is:
ss -tan
This will show us what TCP connections we have and their status. If we have a high amount of connections in statuses like TIME-WAIT or ESTAB this can be useful to see how our application is using networking. However, this does not necessarily mean there is an issue. We should look at the connection patterns, application requirements and system limits.
Using ping and traceroute
The ping command will check if we are getting a response from our destination. It will also tell us how long it is taking to communicate.
ping example.com
If we are getting unusual response times or packet loss we could investigate if there is network congestion, connection issues or issues with our communication. The traceroute command will give us more information about our network.
traceroute example.com
This can be useful if our application is having issues with communication delays. For example, if our web application is slow to respond because our database server is on another network we could investigate if our communication is causing this. However, some routers/network devices won’t respond so we may not get a response.
Investigating with tcpdump
The tcpdump tool will capture and show us packets going through our selected network interface. This can be useful to investigate how our communications are running, connection issues and unexpected network activity.
sudo tcpdump -i eth0
We can use packet captures to see if our requests are reaching our server and if we are getting any responses. For example, if there are continual connection attempts and we aren’t getting any responses this could indicate an issue. Packet captures can contain sensitive information so we should be careful. Developers should use the correct filters to minimise capturing unnecessary data.
Performance Monitoring and Benchmarking
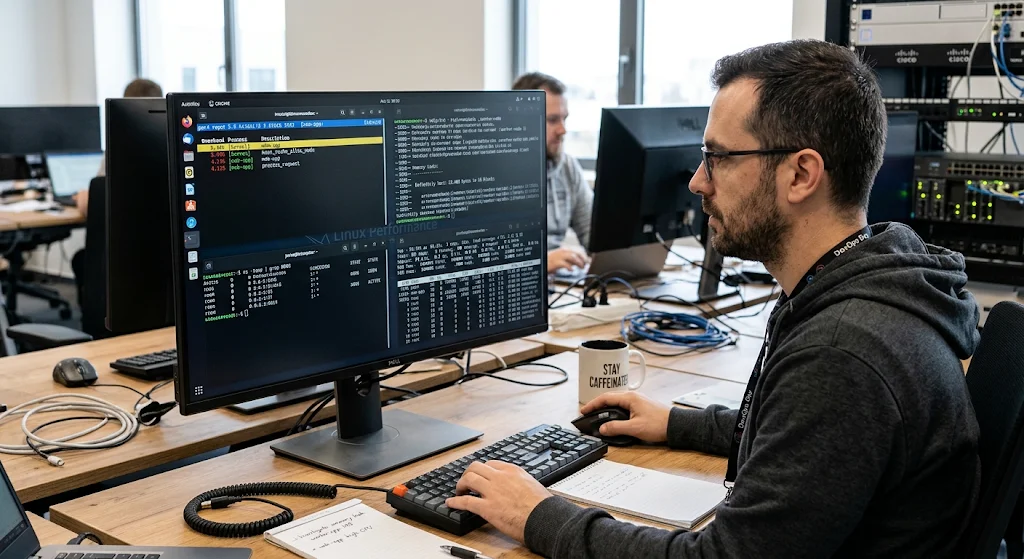
Performance monitoring will help gain quantitative measurements on how efficiently an application is completing operations. Monitoring tells you what is happening within the normal flow of your application, whereas benchmarking will give you insight into how efficiently your application is running in a controlled environment. Useful metrics for gaining insights into performance include execution time, CPU usage, memory usage, throughput and response time.
It can be very useful to compare different implementations to see if any improvements have been made. Performance testing can be very important when making large changes to an application as improvements in one area can add overhead in others.
Execution Time
The time command within Linux gives you the execution time of a program. You can run:
time ./application
When you run this command you will often get values for real, user and system time. Real time is the total amount of time taken to run your application. User time is how much CPU time was used to run the code within your application. System time is how much CPU time was used to run OS operations for your process. This can help to see if your application is spending most of its time calculating or calling OS functions. If you find that the system time is high then this may indicate that there are a lot of system calls being made. As with all monitoring tools this should be used along with other diagnostic tools.
Benchmarking
Benchmarking can help to identify how different methods of solving a problem perform. For example, two different methods of processing files may give the same results but one could have a significantly longer execution time and higher memory usage. When benchmarking you should ensure you have a consistent input and environment. Tools like hyperfine can be used to run multiple benchmarks on the command line and give helpful statistics.
hyperfine ‘./version_one’ ‘./version_two’
When benchmarking you should ensure that things are consistent. Ensure that you use realistic examples of what your application will be doing. You should also make sure that you run the benchmarks multiple times and look at what is running in the background. You should also look at average performance and any outliers that may be affecting users. In a production environment you may want to look at the 95th and 99th percentile for your response times. Ultimately, benchmarking should be used to make practical decisions.
Common UNIX Performance Issues and Diagnostics
Performance issues can often be caused by multiple factors so it is important to try and troubleshoot them in a structured way. Your application could be running slowly due to CPU contention, memory issues, inefficient file operations or network issues. Just because one metric is performing oddly doesn’t necessarily mean you know what the issue is.
You should gather information, look into the processes running and try to recreate the issue. Below are some examples of common performance issues that a system programmer or admin can look into when using different diagnostic tools.
CPU Usage is High
If you have an application running slowly in production and you notice that the CPU usage is consistently high. As an admin you can start by running top to see what process is taking up the most resources. Once you know what process is causing the issue you can run perf to profile the CPU usage. This will help you find out which functions are taking up the most CPU. Once you have the report you may notice that one function is constantly performing an expensive calculation or inefficient loop.
You can use GDB to look into this function and understand what is going on. Once you have fixed the inefficiency of the function you can benchmark the application to see if the CPU usage and response times have improved. This uses monitoring to see where the issue is, profiling to see what is causing the bottleneck and debugging to investigate the code.
Memory Usage Increasing Over Time
You may have an application running in the background that is performing fine but the memory usage is increasing over time. Eventually this causes other processes to slow down as there isn’t enough memory available. As an admin you can look into the memory usage using free -h.
Once you know what process is having issues you can run the application using Valgrind in a suitable test environment. If the report shows there are memory leaks then you can look into the relevant parts of the source code and fix the memory logic. Run the application with a realistic workload to see if the memory usage is stable.
Application Not Responding
Your application may be unresponsive due to it waiting on a file, network or other resource. As an admin you can run top and ps to see what state the process is in and what is happening with the system. As a developer you can attach strace to the process using the process ID. If the trace shows that it is waiting on a certain file descriptor or communications repeatedly then this will show where the issue is.
You may also want to check the network connections using ss or look into the logs for that service. Once you know what is causing the application to wait you can look into whether the application needs to handle timeouts better, have improved error handling or better communication with external services.
File Processing is Slow
If your application processes files then it may be causing performance issues with large files. You can run strace to see how many times functions like read() and write() are being called. If the trace shows that there are a lot of small operations then you can look into whether the application would benefit from larger buffers or more efficient file processing.
You can also look into the CPU and disk usage using the relevant monitoring tools. Once you have changed the implementation you should benchmark both versions using the same files. This will allow you to see if the changes have improved the execution time without causing too many memory issues.
Best Practice for Performance Debugging in UNIX
To effectively debug performance issues you should take a structured approach. Firstly you should know what the issue is and when it is happening. Using monitoring tools will help you to see if there are any issues with CPU, memory, disk or network. Once you know what area is likely to be the issue you can use tools like GDB, strace, perf and Valgrind to get more detailed information. This will help to avoid any unnecessary investigation.
Getting a baseline for your performance will help. A baseline will tell you what resources your application will normally use and how it will perform. This will help you to know if a certain CPU or memory issue is unusual. Ensure production systems have proper logging and monitoring in place so that if something happens unexpectedly you can look into it. Be careful with your diagnostics as some tools can add overhead. Try to use a suitable testing environment and make sure that the proposed fixes have improved the reliability of your application.
Conclusion
It is an important skill to be able to monitor and debug performance issues within UNIX. Using tools like GDB, strace, top, htop, perf, Valgrind, ss and tcpdump will give you different insights into what is going on with your application. This can help to identify issues with too many system calls, memory leaks, CPU bottlenecks, blocking, inefficient file processing and network.
Knowing how to interpret the outputs will help you to not make assumptions and get measurable evidence to investigate the performance. Using a structured approach with monitoring, debugging, profiling and benchmarking can help to improve the efficiency of your application, reduce downtime and have a more reliable UNIX/Linux environment. These can also help to improve software development practices by helping programmers identify issues quickly.