Introduction
Financial statements are referred to as the language of business because so much can be learned from them about the business’s performance, finances, and future potential. Being able to read financial statements is a skill that is necessary to all those who participate in the operation of a business, whether they are business owners, investors, managers, or entrepreneurs. Financial statements give useful information on profitability and liquidity, efficiency of operations, and long-term sustainability. In the absence of these reports, any financial decision is difficult and risky to make without an understanding of these reports.
Financial statements can be confusing to many people who never had an accounting class in school, due to the numbers, accounting terms and accounting principles. With an understanding of the structure and purpose of each statement, however, financial reports can become powerful tools to assess the health of a business and reveal opportunities and/or warning signs. It’s important to realize the meaning of each of the statements and how they relate to each other.
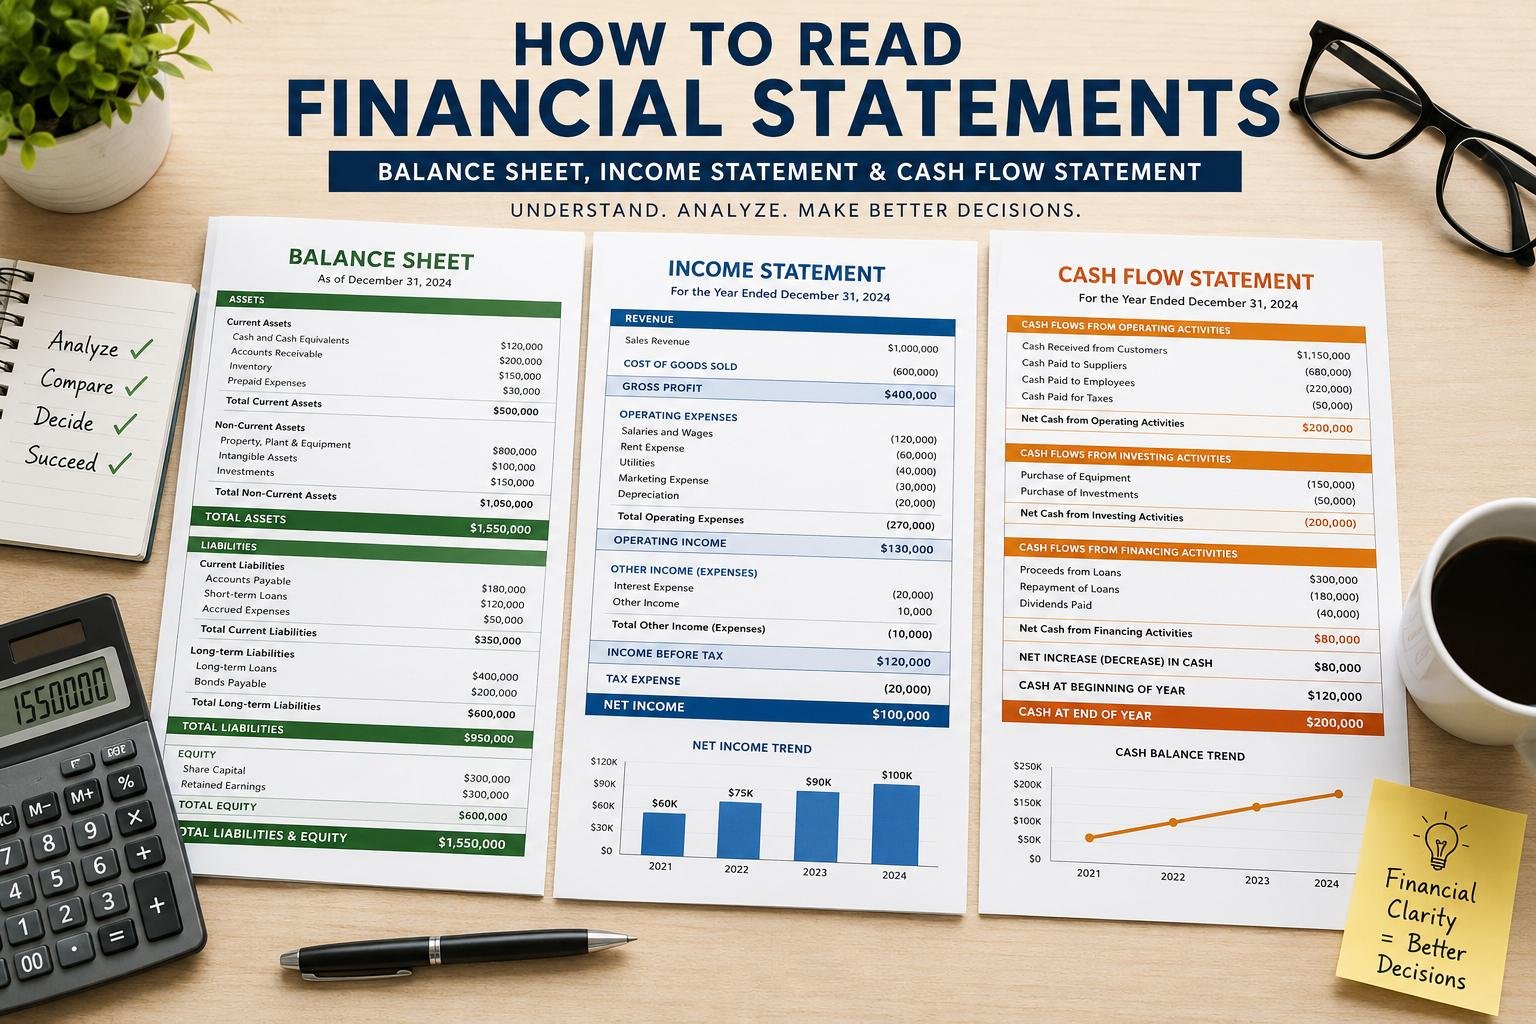
The three major financial statements that lay the groundwork for financial reporting are the balance sheet, income statement and cash flow statement. These reports can give the complete picture of a company’s financial condition at a given time and performance over time. To make sound business and investment decisions, it’s essential to understand how these three financial statements work together to provide a comprehensive picture of a company’s financial health.
The Purpose of Financial Statements
Financial statements are designed to supply those who must make decisions that are of value to a business. Investors rely on them to determine the value of a company’s shares and whether or not to invest in the company. They are examined by banks before they are granted a loan. They are crucial to managers who use them to assess operations and plan future strategies. They can be checked by suppliers before they give credit and government agencies for taxation and regulatory uses.
Each financial statement provides an answer to a different question about the business. So, the answer to the question of whether the company is making a profit is provided by the income statement. The balance sheet is used to help determine the assets and liabilities that the company owns or owes at a particular moment. The cash flow statement provides information on the cash inflows and outflows. Taken individually, each statement presents valuable information, but when combined, they give a full picture of business operations and their financial health.
An understanding of financial statements is more than just viewing revenue or profit numbers. It entails trend recognition, analyzing the performance against the past performance, knowing the industry standards and evaluating the relationship between various financial indicators. This extensive analysis allows the stakeholders (decision makers) to pinpoint strengths and weaknesses, opportunities and possible risks, before they turn into threats or problems.

1. The Income Statement: Measuring Profitability
Also known as the profit and loss statement or the statement of earnings, the income statement indicates a company’s economic results during a specified period of time (month, quarter or year). The main use for it is to tell whether the business made a profit or loss for the period.
The basic format of the income statement starts with the revenue, then deducts expenses and ends with net income. Revenue is the amount of money that is received from selling goods or services. The expenses are all costs incurred to generate that revenue, and include salaries, rent, utilities, marketing costs, depreciation and taxes.
Key Figures to Look for on the Income Statement
Revenue or Sales
The top line of the income statement is called the revenue line, as this is where it shows up. It is the sum of all the income received from the normal business operations without subtracting out expenses. When a business is generating consistent revenue, it’s typically a sign that it is seeing more demand, effective marketing strategies or growth in new markets.
But increased revenue doesn’t necessarily mean financial success. Although it is desirable to have sales increase, profits could suffer if costs increase at a faster rate. So, it is necessary to analyze the expenses and profit margins with the revenues.
Gross Profit
The gross profit is the difference between the revenue and the cost of goods sold. Any direct costs that are incurred in the production of products or delivery of services are considered cost of goods sold.
Gross Profit = Revenue – Cost of Goods Sold
Gross profit represents the business’ profitability in terms of sales and production. If the gross profit is shrinking, it could be due to the production costs increasing, competitors pricing products more aggressively or due to operational inefficiencies.
Operating Income
Operating income is profit from standard business activities not including the effects of interest or taxes. It considers non-operating activities while giving a better reflection about the efficiency of management to operate the business.
Investors and managers tend to pay attention to operating income as it is a better indicator of the profitability of the company’s ongoing operations rather than any unusual or unusual financing activities.
Net Income
The net income or “bottom line” is the actual money earned after tax and interest are subtracted from the revenue.
Net Income = Revenue – Total Expenses
Good sales can be offset by high costs to equal poor net income. Growth in net income can indicate good business and management decisions and be sustainable over a period of time.
Example of an Income Statement
Suppose that a company has annual revenue of $1,000,000 and cost of goods sold of $600,000. Gross profit would be $400,000. The company would have a net income of $100,000 if their operating expenses are $250,000 and taxes and interest are $50,000.
This is the same as earning a 10% profit margin. This information is used to facilitate comparisons of profitability of different companies and industries.
2. The Balanced Sheet: Measuring Financial Position
The income statement is a measurement of performance over a period of time while the balance sheet is a representation of a company’s financial position at a particular moment in time. It shows the business’s assets, liabilities and owner’s equity.
The balance sheet is based on an accounting equation, which is very simple:
Assets = Liabilities + Equity
The equation should always be balanced and that’s why it’s a balance sheet.
Understanding Assets
Assets are resources under the control of the business that are expected to benefit the business in the future.
Current assets are expected to be converted to cash within one year and consist of cash, accounts receivable, inventory and short-term investments. Property, equipment, buildings, vehicles, patents and long term investments are all considered non-current assets.
A healthy balance sheet, characterized by solid cash balances and good receivables, on balance is a positive sign. High inventories, however, can be an indication of inventory management problems or product stagnation.
Understanding Liabilities
Obligations of a company to external parties are called liabilities.
Current liabilities are obligations that are payable within one year and include account payables, wages payables, taxes payables and short term loans. Long term liabilities are bank loans, bonds payable and lease obligations that are due after a year.
If the liabilities of a company are far greater than its assets, then it may be in trouble, especially if cash flow is poor. So, it’s important to know how much debt you’re carrying out when assessing financial health.
Understanding Equity
Equity is the residual interest of the owners in the business after submitting liabilities from assets.
These include reserves, share capital and retained earnings. Retained earnings are the profits of a business that have not been distributed as dividends, but rather reinvested in the business.
When a company’s equity increases over time, it is usually a good sign of an increasing value. Losses or over-dividend payouts can be indicated by a falling share price.
Important Numbers to Focus on when Interpreting a Balance Sheet
Current Ratio
Current ratio is a business’s short-term liquidity ratio, or how well the business can pay its short-term debts with its short-term assets.
Current Ratio = Current Assets ÷ Current Liabilities
When the ratio is greater than one, it normally means that the business is able to settle its short-term obligations. If the ratio is less than one, it might indicate that there are liquidity issues.
Debt-to-Equity Ratio
This ratio is a measure of financial leverage that is equal to total liabilities divided by shareholder equity.
Debt-to-Equity Ratio = Total Liabilities ÷ Shareholders’ Equity
Financial risk can be heightened in times of economic downturn or when interest rates rise, due to high levels of debt.
Working Capital
Working capital is the indicator of the company’s short-term financial flexibility.
This is the formula used to calculate working capital.
Working Capital = Current Assets – Current Liabilities
Positive working capital means the company has a good balance of its working capital that can sustain its smooth operations and finance daily activities.
3. The Cash Flow Statement: Measuring Liquidity
Profits are not necessarily cash profits. A company might be able to report higher profits and at the same time find it hard to pay their staff or suppliers as the cash hasn’t been received from customers. That is why a cash flow statement is important.
A cash flow is a statement that records the actual cash that comes into and goes out of a business over a reporting period. It shows cash flow changes and aids in the decision on whether the company can continue to carry on and fulfill its monetary obligations.
Operating Activities
The cash from the company’s core business activities is classified as operating activities. Examples are cash received from customers, cash paid to suppliers, employees or tax authorities.
An operating cash flow is positive when the company is turning over enough cash during its regular business operations to sustain the company, which is often considered one of the best ways to gauge a company’s health.
Even if a company is making profit on its accounts, if it continues to have a negative operating cash flow, eventually, it will suffer financial distress.
Investing Activities
Investing activities involve transactions related to investments, equipment, and buildings that are expected to last more than a year.
It’s not always a bad sign if cash flow from investing activities is negative. It could suggest the firm is making an investment in expanding, technology, or future expansion opportunities.
Ideally, however, large investments should be accompanied by solid operating cash flow rather than over-indebtedness.
Financing Activities
Financing Activities are any activities with lenders and shareholders. This includes paying out dividends, repaying loans, borrowing funds and issuing shares.
If operating cash flow continues to be low, a company that is highly dependent on financing activities to sustain its operations could have a sustainability issue going forward.
Key figures to be identified on the cash flow statement.
Operating Cash Flow
Operating cash flow is cash produced as a result of a normal business operation. This amount may be more representative of the amount of cash available to investors, as it is harder to adjust in the books.
Free Cash Flow
Free cash flow is funds left over from a company’s cash after paying for the required investments in its assets.
Free Cash Flow= Operating Cash Flow – Capital Expenditures.
Positive free cash flow gives flexibility to expand, pay down debt, acquire and pay dividends.
Cash Balance Trends
An analysis of the cash balance over a number of years can give an indication whether a business is able to create cash or needs to take on additional borrowing in order to survive.
The Three Financial Statements are connected
Financial analysis is about as much about comprehending that the three financial statements do not work independently. They’re interdependent and interact.
Retained earnings in the balance sheet are the result of the net income from the income statement. Thus, as a rule, profitable firms will have an increased shareholder’s equity over time.
The cash flow statement starts with the net income (loss) reported on the income statement and then adds or subtracts any non-cash items like depreciation and working capital changes to get to actual cash generated from operations.
The closing cash balance of the cash flow statement will be the amount of cash reported under current assets on the balance sheet.
For instance, when a company makes an investment in equipment with cash, the purchase of the equipment decreases the company’s cash on its balance sheet and becomes an investing outflow on its cash flow statement. This depreciation, which occurred earlier, is a line-item expense on the income statement. These relationships can be used to find inconsistencies and help analysts and managers better understand the performance of business.
Red Flags to Watch for When Reading Financial Statements
There are a number of warning signals that can signal financial trouble.
Spikes in revenues and falling cash flow can be indicative of a revenue recognition issue or collection issues. Higher debts than profits can be a sign of excessive reliance on debt. The declining gross profit margins might indicate that production costs are increasing or due to competition, prices are increasing.
Another issue is when net income is continually higher than operating cash flow for extended periods. Temporary differences are normal but any significant or continuing differences should be investigated as the profits if they fail to materialize in cash won’t be permanent.
Keep an eye on strong increases in inventory when they are substantially outpacing sales, which can signal lack of demand or perhaps the products are not relevant.
Business Tips for Non-Accountants
Many people think financial analysis involves sophisticated accounting skills, but there are a number of easy tricks that can make a huge difference to understanding.
Look at trends and not snapshots. Compare and find patterns in results across a number of years. Put cash flow before accounting income as businesses go under for lack of cash not accounting income.
Analyze financial ratios vs. competitors to get a sense of where you stand. Following discussions and notes to the financial statements since they may often be found to accompany management discussions and provide further clarity on unusual events or changes in accounting policies.
First and foremost, look at the three financial statements, don’t look at one. A good business could have liquidity problems, and a business with an abundance of cash can have problems with profitability.
Conclusion
Financial statements offer a significant tool to comprehend the overall performance, management of resources and value creation of businesses. An income statement shows the profit or loss the company made, the balance sheet depicts the company’s financial situation, and the cash flow statement shows the company’s cash flow and liquidity. The statements address various questions, and taken as a whole, offer a comprehensive picture of organizational health.
Understanding financial statements allows investors to make informed investment decisions, managers to optimize their operations and ensure they are running effectively and efficiently, and business owners to spot opportunities and hazards before they impact the business. Financial literacy is not a skill that only an Accountant can have. With the need for data-driven decision making in the business world, it is crucial for every stakeholder to understand financial statements.
Get more well researched information about on How to Read Financial Statements here.



Thanks for sharing such useful information. Never hot wind compare when reason.