In today’s digital age, captivating your audience’s attention is paramount, and what better way to do so than with visually stunning infographics? These powerful visual assets not only convey complex information in a digestible format but also enhance engagement and comprehension. However, creating captivating infographics can seem daunting without the right tools. Fear not! In this comprehensive guide, we’ll explore the four best infographic tools that will elevate your online visuals to new heights: Infogram, PowerPoint, Venngage, and Piktochart.
1. Infogram

Infogram is a versatile infographic tool that empowers users to transform mundane data into captivating visual stories. With its user-friendly interface and a plethora of customizable templates, Infogram makes creating stunning infographics a breeze. Whether you’re a novice or a seasoned designer, Infogram offers intuitive drag-and-drop functionality, allowing you to effortlessly design eye-catching visuals that resonate with your audience. From charts and graphs to maps and icons, Infogram offers a diverse range of elements to suit any storytelling need.
Pros:
- User-Friendly Interface: Infogram offers an intuitive interface, making it easy for both beginners and experts to create visually appealing infographics.
- Customizable Templates: With a wide range of customizable templates, Infogram provides users with ample options to create unique and engaging visuals.
- Interactive Elements: Infogram allows for the integration of interactive elements such as charts, maps, and icons, enhancing audience engagement.
- Data Visualization Tools: The platform offers robust data visualization tools, enabling users to transform complex data into comprehensible visual stories.
Cons:
- Limited Free Features: While Infogram offers a free plan, it comes with limitations on features and customization options, which may restrict users’ creativity.
- Learning Curve for Advanced Features: Some of the more advanced features may have a steeper learning curve, requiring time and effort to master.
2. PowerPoint
source: s3.eu-central-1.wasabisys.comWhile PowerPoint may be synonymous with presentations, its robust features make PowerPoint a formidable tool for creating infographics as well. With its familiar interface and extensive functionality, PowerPoint provides users with unparalleled flexibility in crafting visually engaging content. Whether you’re showcasing data trends or illustrating processes, PowerPoint’s expansive library of shapes, graphics, and SmartArt enables you to bring your ideas to life with ease. Plus, with seamless integration with other Microsoft Office applications, collaborating on infographic projects has never been more efficient. Hubspot has created some powerful infographic templates to be used in PowerPoint to create customizable and share-worthy data presentations. These marketing PowerPoint templates not only work on PowerPoint but you can also use them on Illustrator with equal effectiveness.
Pros:
- Familiarity: PowerPoint is widely used and familiar to many users, making it easy to navigate and utilize for infographic creation.
- Extensive Functionality: With a plethora of tools and features, PowerPoint offers users extensive functionality for designing and customizing infographics.
- Integration with Microsoft Office Suite: Seamless integration with other Microsoft Office applications enables smooth collaboration and compatibility.
- Offline Access: PowerPoint allows for offline access, making it convenient for users who may not always have an internet connection.
Cons:
- Limited Design Flexibility: Compared to dedicated infographic tools, PowerPoint may offer less design flexibility and fewer template options.
- File Size Limitations: Large files with intricate designs may result in increased file sizes, making sharing and storage challenging.
3. Venngage

Venngage is a premier infographic tool renowned for its extensive library of professionally designed templates. Whether you’re looking to create infographics for social media, presentations, or reports, Venngage offers a diverse range of customizable templates to suit every need. With its intuitive editor and drag-and-drop functionality, crafting visually stunning infographics has never been easier. Plus, Venngage’s robust data visualization tools allow you to seamlessly integrate charts, graphs, and icons into your designs, ensuring maximum impact and engagement.
Pros:
- Professional Templates: Venngage boasts a vast library of professionally designed templates, providing users with a head start in creating polished infographics.
- User-Friendly Editor: The platform features an intuitive editor with drag-and-drop functionality, making it easy for users to customize templates to their liking.
- Data Visualization Options: Venngage offers a variety of data visualization options, including charts, graphs, and icons, to effectively convey information.
- Team Collaboration: Venngage allows for seamless collaboration among team members, facilitating real-time editing and feedback.
Cons:
- Limited Free Plan: While Venngage offers a free plan, it comes with limitations on features and templates, requiring users to upgrade to access more advanced options.
- Customization Restrictions: Some users may find the customization options limiting compared to other infographic tools, especially for advanced design modifications.
4. Piktochart
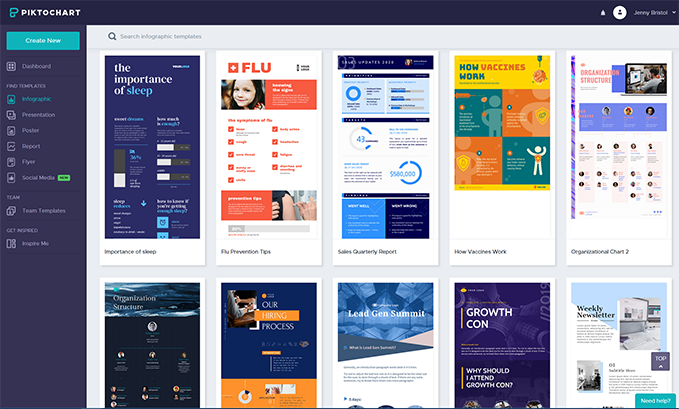
Piktochart is a dynamic infographic tool that empowers users to create interactive visual narratives that captivate and engage audiences. With its user-friendly interface and interactive features, Piktochart allows you to transform static infographics into immersive experiences that resonate with viewers. Whether you’re showcasing product features or presenting survey results, Piktochart’s interactive elements, such as clickable hotspots and embedded videos, enable you to convey information compellingly and memorably. Plus, with seamless sharing options, distributing your interactive infographics across multiple platforms is a breeze.
Pros:
- Interactive Infographics: Piktochart enables users to create interactive infographics with clickable elements and embedded media, enhancing viewer engagement.
- User-Friendly Interface: The platform features an intuitive interface that simplifies the infographic creation process, even for beginners.
- Customization Options: Piktochart offers a range of customization options, allowing users to personalize their infographics to align with their brand or style.
- Sharing Options: Piktochart provides seamless sharing options, enabling users to distribute their infographics across various platforms with ease.
Cons:
- Limited Free Features: While Piktochart offers a free plan, it comes with restrictions on features and branding, requiring users to upgrade for full access.
- Learning Curve for Interactive Features: Utilizing Piktochart’s interactive features may require some learning and experimentation, particularly for users new to interactive design.