Introduction
One of the foundations of biostatistics is hypothesis testing which gives a structured approach to making decisions using data. It can be used to assess evidence, test hypotheses, and make conclusions about populations, with sample data in medical and other types of research studies in the field of public health. Hypothesis testing is at the center of the stage whether it is to determine the effectiveness of a new drug, and determine the risk factors of disease or even comparing the effects of treatment; in this case, the reasoning behind the conclusion should be statistical as opposed to being given by chance.
This paper gives an in-depth discussion of the hypothesis testing in biostatistics with emphasis on its principles, procedures and interpretation. Researchers and students can learn how to steer clear of the pitfalls by learning the logical structure and limitations of it, which in turn would enhance validity of their findings. https://en.wikipedia.org/wiki/Statistical_hypothesis_test
Learning about Hypothesis Testing
Hypothesis testing is in its simplest form, a decision making process that utilizes data. It consists of making assumptions about a parameter of the population and subsequently using the information about a sample to determine whether the assumptions make sense.
In order to delve into a more detailed background description, you may consult this source on hypothesis testing that provides the theoretical foundation and uses of statistical inference.
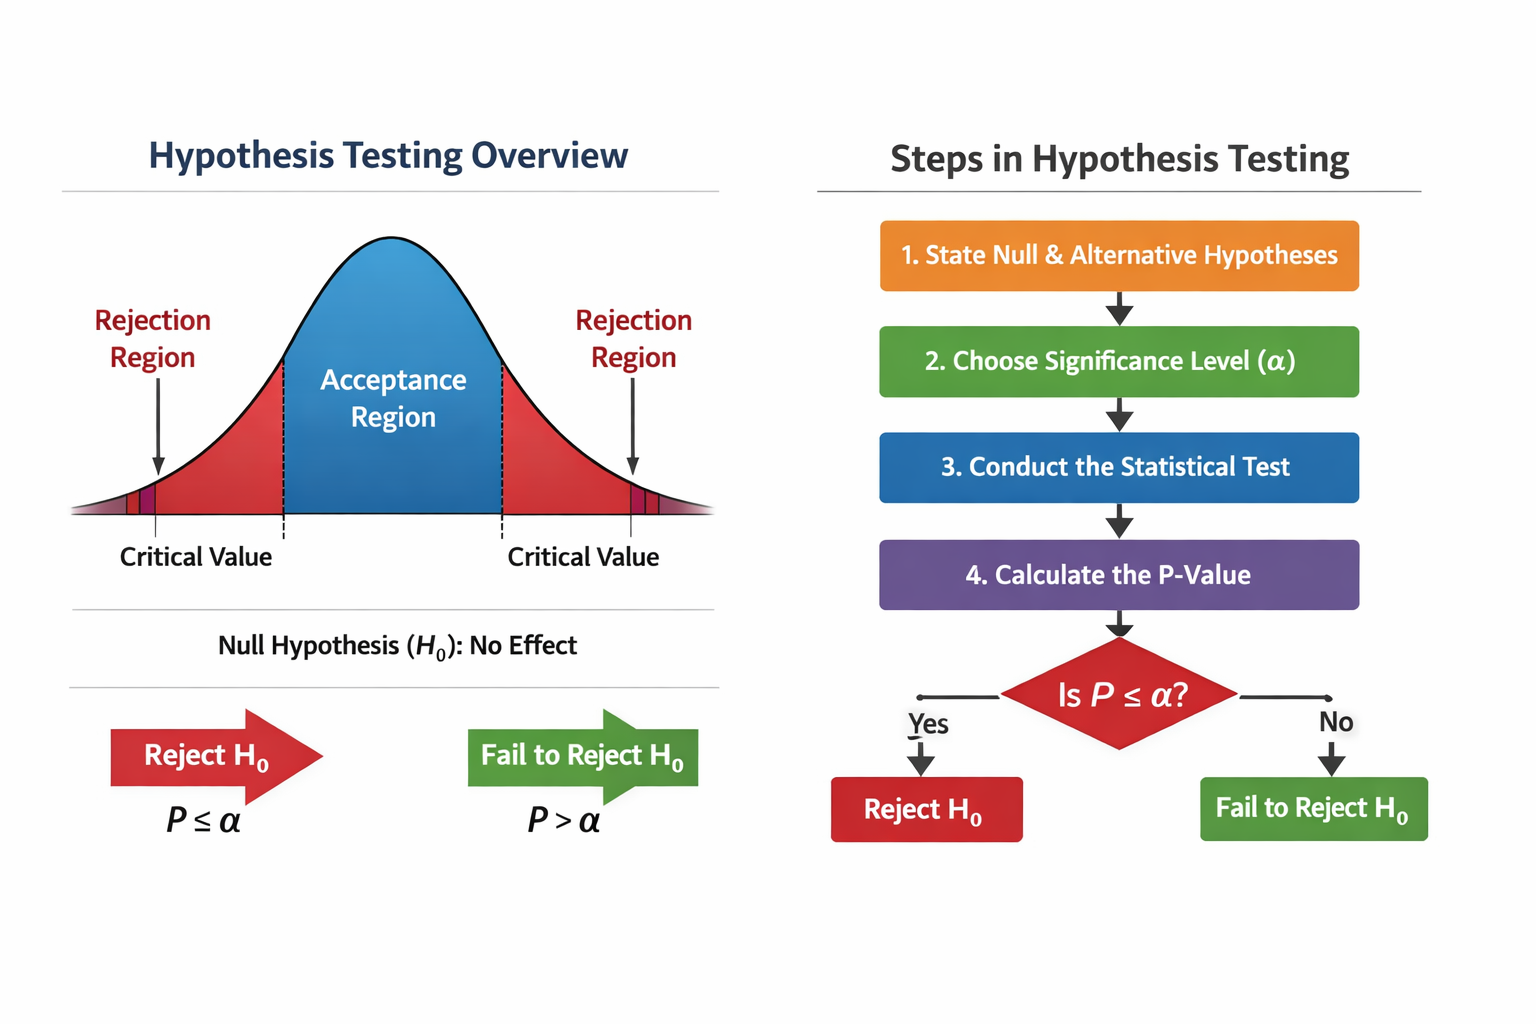
The sequence of hypothesis testing works in a logical manner:
- Formulate hypotheses
- Choose a significance level
- Select an appropriate test
- Test statistic and data analysis.
- Analyze findings and make a choice.
All these measures lead to a strict and clear analytic procedure.
Formulating Hypotheses
Null Hypothesis (H0)
The null hypothesis is that of the default or status quo. It normally declares that there is no effect, there is no difference or an association between variables.
Examples:
- Blood pressure is not affected by a new drug.
- Two treatment methods have no difference in recovery rates.
We do not accept the null hypothesis that Southwest Airlines Company’s management and leadership do not align their compensation methods with their vision, mission, and business strategies
Alternative Hypothesis (H1 or Ha)
The alternative hypothesis is the statement that the researcher expects to prove. It implies that there exists an effect, difference or relationship.
Examples:
- One of the new drugs reduces blood pressure.
- One therapy results in quicker healing compared to another.
Categories of Alternative Hypotheses.
- Two-tailed (non-directional): Tests of any difference (e.g., A Two-tailed (non-directional): Tests of any difference (e.g., A B)
- Directional (one tailed): Tests based on a given direction (e.g., A > B or A < B)
The decision to use two tailed or one tailed tests is determined by the research question and must be made prior to a start of data analysis.
Significance Level (a)
The probability of accepting the null hypothesis as false is the level of significance which is represented by a (alpha). It is used as a criterion to provide the answer whether an observed outcome is statistically significant.
Common values include:
- 0.05 (most widely used)
- 0.01 (more stringent)
- 0.10 (less stringent)
To illustrate, a level of 0.05 indicates a risk of 5% to end up with a conclusion that an effect exists where it is not. This limit is used to regulate the possibility of false-positive outcomes.
Statistics and Sampling Distribution of Tests
A test statistic is a number of sample information that is computed and used to test the null hypothesis. It is used to determine the extent to which the data observed are in variance with what would have been expected with the null hypothesis.
Ordinary test statistics of biostatistics are:
- Z-statistic (when the variance is known or is large)
- t-statistic (when samples are small and the variances are unknown)
- Statistic Chi-square (categorical data)
- F-statistic (variance comparison) F-statistic (comparing more than two groups)
The test statistic is distributed with a given probability distribution, which is referred to as the sampling distribution. This distribution enables researchers to establish the probability of a specific outcome to occur within the null hypothesis.
P-Values and Their Meaning
One of the concepts that are most commonly utilized in testing a hypothesis is the p-value. It is the likelihood of attaining a result as extreme as, or more extreme than, the observed data, in the event that the null hypothesis is accepted.
Interpreting the P-Value
- p [?] a: Reject the null hypothesis.
- p >a: Reject the null hypothesis.
As an illustration, a = 0.03, p = 0.05 gives a statistically significant value, which rejects the null hypothesis.
Important Considerations
- The significance that is so low does not imply that the alternative hypothesis is true.
- Having a large p-value does not indicate that the null hypothesis is correct.
- The p-value does not indicate any measure of an effect size or importance.
The probable problem in research is misinterpretation of p-values and such misinterpretation may result in misleading conclusions.
Type I and Type II Errors
Hypothesis testing is prone to errors due to the fact that the decisions made on the sample data are not based on all population data.
Type I Error (False Positive)
It happens when the null hypothesis is rejected, but they are true.
- Probability = a
- E.g. The conclusion of a drug is successful when, in fact, it is not.
Type II Error (False Negative)
Happens when the null hypothesis is not rejected in case the null hypothesis is false.
- Probability = b
- Indicating a null hypothesis: Not finding a real impact of a drug.
Power of a Test
The statistical power is the likelihood of rejecting a false null hypothesis;
Power = 1 [?] b
A powerful study has high chances of identifying real effects and is affected by:
- Sample size
- Effect size
- Significance level
- Variability in data
Steps in Hypothesis Testing
Step 1: creating the Research Question
Formulate the statement of the problem and find the parameter of interest in the population.
Step 2: Formulate Hypotheses
Formulate the null and alternative hypotheses in accordance with the objective of the research.
Step 3: Select Level of Significance.
Before making the analysis, take an appropriate level.
Step 4: Choose the Statistical Test
Choose a test based on:
- Data type (continuous, categorical)
- Sample size
- Study design
Examples:
- t-test for comparing means
- Chi-square test of categorical variables.
- Multiple group comparison ANOVA.
Step 5: Compute the Test Statistics and the P-value
Calculate test statistics and p-value with the help of statistical formulas or software.
Step 6: Make a Decision
Compare the p-value with a:
- Reject H0 if p [?] a
- Fail to reject H0 if p > a
Step 7: Interpret the Results
Give meaning in a meaningful manner in the context of the research question without overgeneralization.
Confidence Intervals and their application
Whereas the hypothesis testing gives a binary decision (reject or not reject), the confidence interval also gives more details by estimating a range of likely values of the population parameter.
For example:
- By a 95% confidence interval, it indicates that, in the event that the study is carried out many times, then 95 percent of the intervals would include the true parameter.
Confidence intervals are used to supplement a hypothesis test by:
- Terminating the accuracy of estimates.
- Indicating a direction and magnitude of effects.
- Assistance in the evaluation of clinical or practical importance.
Application in Interpretation in Biostatistics
To eliminate the misrepresentation of results, proper interpretation is necessary. Clinical importance is not necessarily one that is statistically significant.
Key Points to Remember
Statistical vs Clinical Significance
- An outcome can be statistically important, but not a very useful one.
Context Matters
- The results must be contextualized by the study design, sample and limitations.
Avoid Overgeneralization
- Findings on a particular population are not always applicable.
Consider Effect Size
- Risk ratios, odds ratios, and mean differences are among the measures used to give an insight into the value of an effect.
Widely Spread Fallacies in Hypothesis Testing
False Interpretation of P-values.
Researchers have a common misinterpretation that the p-value is the likelihood that the null hypothesis would be true, which is not the case.
Multiple Testing Problem
The high number of tests is likely to enhance Type I errors. This issue is usually controlled by such adjustments as the Bonferonni correction.
Small Sample Sizes
Small sample size will compromise statistical power and chances of Type II errors.
Data Dredging (P-Hacking)
The repetitive process of data analysis up to the discovery of meaningful outcomes may give allusions to false inferences and compromise the scientific integrity of such research.
Biostatistics: Applications in Biostatistics
Hypothesis testing is extensive in many fields of health research:
- Clinical trials: Determining the efficacy of treatment.
- Epidemiology: Risk factor identification and association.
- Public health: Intervention and policy evaluation.
- Laboratory research: Comparison of experimental conditions.
In both instances, the aim is to be able to make informed decisions grounded on empirical evidence and taking into consideration uncertainty.
Ethical Considerations
Transparency and honesty in statistical analysis are needed in the ethical practice of research. There are detrimental effects of hypothesis testing when abused particularly in healthcare decision-making.
Researchers should:
- Predetermine hypotheses and plans of analysis.
- Present all results and include non-significant results.
- Do not be selective in reporting or handling of data.
Hypothesis testing is a method that requires responsible usage in order to have reliable and reproducible scientific conclusions.
Conclusion
Biostatistic hypothesis testing offers a scientific process of testing evidence in a logical and systematic manner. Researchers can make meaningful conclusions using data through proper formulation of hypotheses, choice of level of significance and proper interpretation of the results.
The thing is that the significance of hypothesis testing is in its approach as well as in adequate interpretation. The knowledge of such concepts like p-values, Type I and Type II errors, and statistical power is crucial with the help of which it is possible to avoid the main mistakes and guarantee the validity of research results.
Finally, hypothesis testing is a mighty instrument, but it should be applied with a sensible and responsible approach. Together with sound study design, sufficient sample size, and clear reporting, it can be used as the cornerstone of evidence-based practice in biostatistics and beyond.