Pricing, Features, and Trade-Offs Compared
Every APM tool in 2026 claims full-stack observability. The real differences are in what you give up: pricing predictability, data control, vendor flexibility, or operational simplicity. No tool wins on every dimension, and the right choice depends more on your constraints than on feature checklists.
This guide breaks down seven credible APM platforms across the dimensions that actually drive regret or satisfaction 12 months after signing: cost at scale, data residency, OpenTelemetry support, and the trade-offs each vendor asks you to accept. If your team is evaluating APM options – or questioning whether your current tool is still the right fit – the comparison table and per-tool breakdowns below should make the decision more concrete.
Reference Scenario for Cost Estimates
| Assumption | Value |
|---|---|
| Monthly ingestion | 30TB (~20TB logs, 7TB traces, 3TB metrics) |
| Retention | 30 days, all signal types |
| Log indexing | 30% indexed, 70% to archive |
| Hosts | 100 |
| Users | 20 full-platform |
| Metric series | 500,000 active |
| Scope | Core observability only |
Estimates are directional, based on public rate cards as of early 2026. Vendor discounts and EDP commitments can reduce SaaS costs significantly.
What to Evaluate Beyond the Feature Matrix
- Pricing model transparency – can you predict your bill at 2x your current scale? Multi-dimensional billing (hosts + metrics + indexing + users) compounds unpredictably.
- OpenTelemetry support – the industry is converging on OTel. Proprietary agents create lock-in, and some vendors reclassify OTel metrics as custom metrics at premium rates.
- Data residency options – increasingly non-negotiable in regulated industries. For most SaaS vendors this is a paid add-on or not available at all; for self-hosted platforms it’s guaranteed by architecture.
- Full-stack coverage – metrics, logs, and traces unified in one platform, not siloed across separate tools with separate bills.
- Migration path – can you trial the tool alongside your existing stack, or does adoption require a hard cutover?
- Support model – when production is down at 3am, do you get an engineer or a ticket queue?
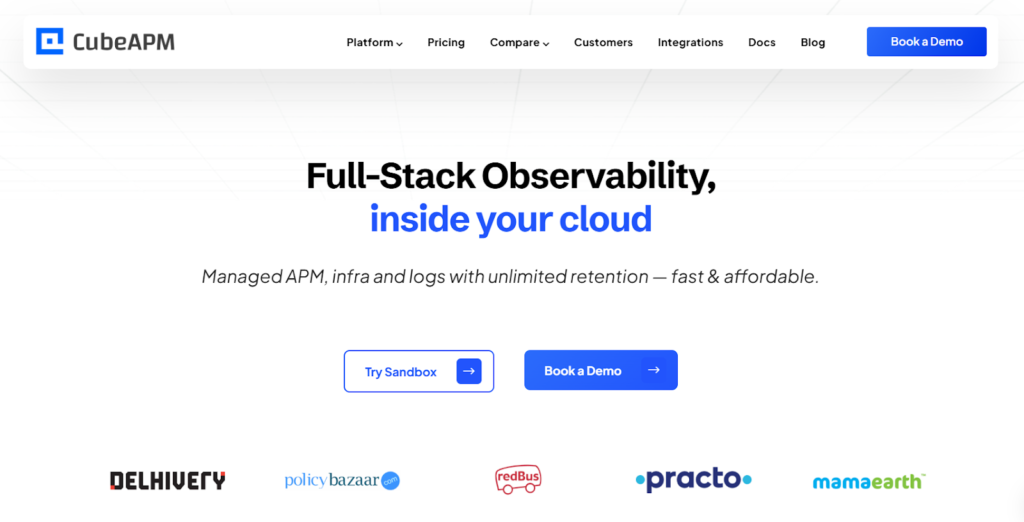
1. CubeAPM
Best for: Cost-sensitive engineering teams, data-sovereign organizations, and teams migrating to open standards
Overview
CubeAPM is a self-hosted, OpenTelemetry-native observability platform covering APM, logs, infrastructure, Kubernetes, RUM, synthetic monitoring, Kafka monitoring, and error tracking. It runs inside your own cloud or on-premises environment, so telemetry data never leaves your infrastructure.
Recognized as a High Performer in G2’s Spring 2026 APM Grid Report and used by redBus (part of NASDAQ-listed MakeMyTrip, 8+ countries), Delhivery ($3.5B valuation), Mamaearth ($1.2B valuation), Policybazaar, Practo, and others.
Key Features
- Full-stack unified monitoring – APM, logs, infrastructure, Kubernetes, Kafka, RUM, synthetic monitoring, error tracking
- OpenTelemetry-native from day one – no proprietary agents; compatible with existing Prometheus, Datadog, and New Relic agents for incremental migration
- Self-hosted and BYOC deployment – data sovereignty by design
- Data Compliance: CubeAPM’s SOC 2 and ISO 27001 certification demonstrates adherence to industry-recognized security and governance standards.
- Unlimited data retention with no egress surprises
- AI-based trace sampling – retains traces that matter while reducing storage overhead
- Direct engineering support via shared channels – not a ticket queue
Pricing
Ingestion-based at $0.15/GB with no per-host, per-seat, or custom metrics fees.
At 30TB/month: ~$5,100/month all-in
$4,500/month license ($0.15/GB x 30,000 GB) + ~$600/month cloud infrastructure ($0.02/GB covering compute + storage). Unlike SaaS vendors where infrastructure is bundled invisibly into the price, the total cost here is transparent and independently auditable.
Delhivery documented 75% savings after replacing three separate monitoring tools. Mamaearth documented nearly 70% savings and completed migration in under an hour with zero downtime. redBus reported 4x faster dashboards and 50% faster MTTR.
Trade-offs
- Strength: The simplest pricing model and lowest cost at scale. Single billing dimension ($0.15/GB) means no surprises from metrics, hosts, or users. Consistently 70–75% lower cost than enterprise APM at scale
- Strength: Multi-agent compatible – works alongside Datadog, New Relic, Elastic, and Prometheus agents. Migration is incremental, not a hard cutover.
- Strength: Complete data ownership – no telemetry leaves your infrastructure
- Strength: Unlimited retention, predictable pricing, no egress charges
- Strength: Engineering-level support that responds in minutes during incidents
- Strength: AI-based trace sampling included
- Strength: Fast onboarding – zero-downtime migration documented by multiple customers
- Limitation: Requires BYOC or on-premise deployment comfort – not a SaaS you can spin up in minutes.
- Limitation: No autonomous anomaly detection (AI-based trace sampling is not full AIOps).
- Limitation: SSO/RBAC less mature than enterprise SaaS incumbents.
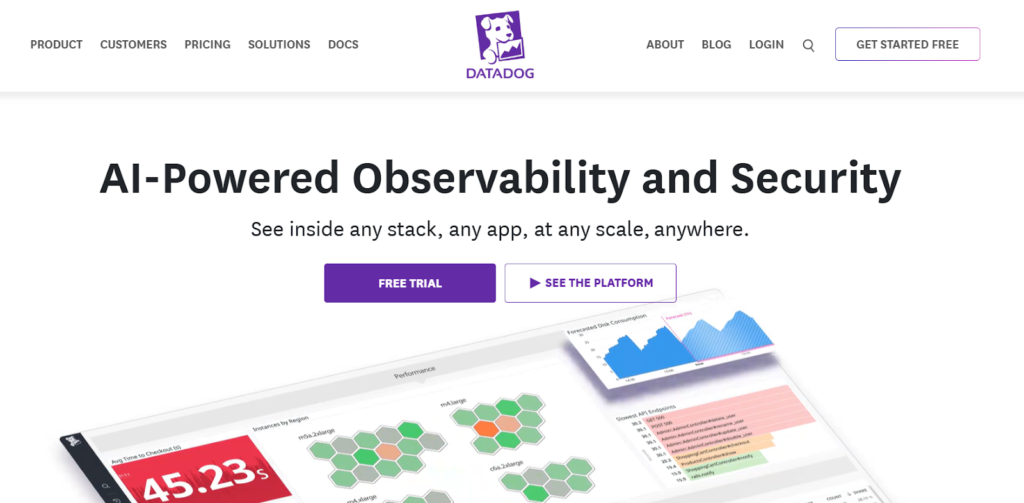
2. Datadog
Best for: Cloud-native organizations that need the broadest integration ecosystem and have the budget to match
Overview
Datadog is the category leader by market capitalization (~$40B) and integration depth. With 700+ integrations, a polished UI, and tight correlation between metrics, logs, traces, and security data, it’s the default choice for many well-funded engineering teams. The trade-off is pricing complexity that requires careful architecture planning.
Key Features
- Unified observability: metrics, logs, APM, RUM, synthetics, security, database monitoring
- 700+ integrations
- Watchdog AI for anomaly detection and root cause surfacing
- Service maps and dependency tracking
- Strong CI/CD and deployment tracking integration
Pricing
Multi-dimensional billing: hosts (per-host/month), custom metrics (per timeseries), log ingestion ($0.10/GB) + log indexing ($1.70/million events at 15 days, ~$2.50/million at 30 days), APM spans, RUM sessions, and container overages.
Custom metrics are the biggest hidden dimension: OTel or application-emitted metrics billed at up to $5 per 100/month beyond host allotment. At scale, this can constitute 30-52% of the total bill.
At 30TB/month: ~$30,000-$45,000+/month
Breakdown (30% logs indexed): 100 hosts ~$2,400 + log ingest 20TB ~$2,000 + log indexing ~$30,000 + APM spans ~$3,000-5,000 + custom metrics ~$5,000+. Log indexing is the dominant cost driver.
Several third-party calculators exist for modeling Datadog bills at scale – worth using before committing to an annual contract.
Trade-offs
- Strength: Best-in-class integration ecosystem and UI polish. Tight metric/log/trace correlation out of the box.
- Strength: Watchdog AI proactively surfaces anomalies – genuinely useful for large environments.
- Limitation: Billing complexity makes cost forecasting difficult. Multiple independent dimensions compound unpredictably.
- Limitation: OTel metrics often billed as custom metrics – penalizes teams adopting open standards.
- Limitation: No self-hosted option; data leaves your infrastructure (for teams where this is a hard requirement, self-hosted platforms like CubeAPM are worth evaluating).
3. Dynatrace
Best for: Large enterprises needing automated root cause analysis and willing to commit to an annual contract
Overview
Dynatrace differentiates through Davis AI, its causal AI engine that performs automated root cause analysis. It’s available as SaaS and as Dynatrace Managed – a full on-premises deployment – making it one of the few enterprise APM vendors supporting true data residency.
Key Features
- Davis AI: causal root cause analysis, not just anomaly detection
- Automatic service discovery and full dependency mapping (Smartscape)
- Full-stack monitoring: applications, infrastructure, Kubernetes, cloud services
- Dynatrace Managed: self-hosted deployment for data-residency requirements
- OneAgent for automated instrumentation; OTel support for traces, logs, and metrics
Pricing
Consumption-based DPS with annual minimum commitment (~$2,000/month minimum). Full-stack monitoring at $0.08/hour per 8 GiB host, log ingest $0.20/GiB, log retention $0.0007/GiB-day. 4 GiB minimum billing for small hosts.
At 30TB/month: ~$20,000-$35,000+/month
Breakdown: 100 hosts x $0.08/hr x 8 GiB x 730 hrs ~$4,700 + log ingest 20TB x $0.20/GiB ~$4,100 + log retention ~$430 + traces/metrics/APM + commitment overhead.
Trade-offs
- Strength: Best automated root cause analysis in the market. Davis AI reduces MTTR without manual correlation.
- Strength: Dynatrace Managed supports genuine data residency – a real differentiator among enterprise vendors.
- Limitation: Mandatory annual commitment locks in spend before you know actual usage patterns.
- Limitation: Heavy reliance on proprietary OneAgent; OTel exists but isn’t the primary path.
- Limitation: 4 GiB minimum billing penalizes lightweight container architectures.
4. New Relic
Best for: Smaller to mid-size teams that want a broad platform with a free tier, or teams with predictable user count and data volumes
Overview
New Relic rebuilt its platform around NRDB, a unified telemetry store. NRQL, its SQL-like query language, makes ad-hoc analysis accessible. The free tier (100GB/month + 1 full platform user) is the easiest entry point in this list.
Key Features
- NRDB: unified telemetry database for metrics, events, logs, and traces
- NRQL: SQL-like query language for custom analysis
- Distributed tracing, service maps, browser and mobile monitoring
- Free tier: 100 GB/month + 1 full platform user
- User-based and compute-based pricing models available
Pricing
Two dimensions: data ingest ($0.40/GB standard, $0.60/GB Data Plus with 90-day retention) + user fees (Core $49/user/month; Full Platform $99-$349/user/month).
At 30TB/month: ~$20,000-$25,000+/month
Breakdown: 30TB at $0.40/GB ~$12,000 + Data Plus for 90-day retention ~$6,000 + 20 full-platform users ~$2,000-$7,000.
Trade-offs
- Strength: NRDB gives genuinely unified telemetry storage. NRQL is one of the best ad-hoc analysis interfaces available.
- Strength: 100 GB/month free tier – best in class for getting started without commitment.
- Limitation: Dual cost axes (data + users) mean both data growth and team growth increase the bill independently.
- Limitation: Default retention is only 8 days; 90 days requires Data Plus at $0.60/GB.
- Limitation: No self-hosted option; all data in New Relic’s cloud.
5. Grafana Cloud (LGTM Stack)
Best for: Teams already running open-source observability, OTel-native shops, and engineers comfortable managing or funding a managed stack
Overview
Grafana Labs assembled the LGTM stack – Loki (logs), Grafana (dashboards), Tempo (traces), Mimir (metrics) – into a coherent observability platform. It’s one of the most OTel-native options available, with no custom metrics penalty – a meaningful advantage for teams that have standardized on OpenTelemetry.
Key Features
- LGTM stack: Loki, Grafana, Tempo, Mimir
- Full OpenTelemetry native support – no custom metrics penalty
- Adaptive Metrics and Adaptive Logs to reduce ingestion costs
- Self-hosted (free) or Grafana Cloud (managed, usage-based)
- 13-month metric retention; 30-day log/trace retention on Pro
Pricing
Grafana Cloud Pro: $19/month base + usage. Logs ~$0.55/GB effective (30-day retention). Traces $0.50/GB. Metrics $8 per 1,000 active series. Enterprise: $25,000/year minimum.
At 30TB/month (managed cloud): ~$15,000-$20,000+/month
Breakdown: 20TB logs ~$11,000 + 7TB traces ~$3,500 + 500K metric series ~$4,000 + base. Adaptive features can reduce this materially.
Trade-offs
- Strength: Fully OTel-native with no custom metrics penalty. Adaptive Metrics/Logs actively help reduce billing.
- Strength: Self-hosted path available for teams with operational capacity – no licensing cost.
- Limitation: Self-hosting at 30TB scale requires dedicated SRE expertise to maintain.
- Limitation: Managed cloud costs approach Datadog/New Relic territory at high log volumes.
- Limitation: APM story less mature than purpose-built APM tools; no built-in AI/ML anomaly detection.
6. Elastic APM
Best for: Teams already running the Elastic (ELK) stack for log management who want to add traces and APM without introducing another vendor

Overview
Elastic APM is the distributed tracing component of the Elastic Stack. For teams already indexing logs in Elasticsearch and visualizing in Kibana, adding APM is natural – the data lives in the same store and queries across logs and traces work natively.
Key Features
- Native Elasticsearch integration: APM data correlates directly with existing log indices
- OpenTelemetry compatible (OTel collector to Elasticsearch)
- Machine learning-based anomaly detection via Elastic ML
- Available self-hosted (free, open-source) or Elastic Cloud
- Service maps and distributed tracing
Pricing
Self-hosted is free; you cover infrastructure. Elastic Cloud pricing is deployment-based – compute, storage tiers, replica count, and region.
At 30TB/month (Elastic Cloud): ~$8,000-$15,000/month
Reference: hot tier, 30-day retention, 1 replica. Elastic’s calculator is the most reliable source for specific configurations.
Trade-offs
- Strength: Zero incremental cost for teams already running Elastic. Strong log + trace correlation in a single query interface.
- Strength: Self-hosted option keeps data on your infrastructure. ML anomaly detection included.
- Limitation: Running Elasticsearch at 30TB/month scale requires significant infrastructure and operational expertise.
- Limitation: APM experience is less polished than Datadog, Dynatrace, or purpose-built tools like CubeAPM.
- Limitation: SSPL licensing change (2021) affects self-hosted compliance – review current license terms.
7. Splunk Observability Cloud
Best for: Large enterprises with existing Splunk investments and substantial compliance requirements
Overview
Splunk Observability Cloud offers full-fidelity distributed tracing with no sampling by default, plus infrastructure monitoring, AI-powered alerting, and deep integration with Splunk’s security and log analytics portfolio. Note: Splunk Observability Cloud and Splunk Enterprise/SIEM are separate products with separate pricing.
Key Features
- Full-fidelity distributed tracing (no default sampling)
- AI-based alerting and anomaly detection
- Deep Splunk SIEM and log analytics integration
- Real-time stream processing for telemetry
- Strong enterprise compliance story
Pricing
Starts at $15/host/month billed annually for infrastructure monitoring. APM and log analytics priced separately via enterprise contract.
At 30TB/month: ~$35,000-$60,000+/month
Estimated based on 100 hosts, APM per-host fees, log analytics volume, and enterprise minimums. Treat this as a floor, not a ceiling.
Trade-offs
- Strength: Full-fidelity traces with no sampling – no blind spots in high-cardinality environments.
- Strength: Best-in-class Splunk Security integration for unified IT and security observability.
- Limitation: Most expensive option at scale by a significant margin.
- Limitation: Best value only for teams with existing Splunk investments; overkill otherwise.
- Limitation: Significant vendor lock-in given the proprietary ecosystem.
Cost Comparison at 30TB/Month Ingestion
| Tool | Est. Cost @ 30TB/mo | Pricing Model | OTel Native | Data Residency | Self-Hosted |
|---|---|---|---|---|---|
| CubeAPM | ~$5,100/mo all-in($4,500 license +$600 infra) | $0.15/GB flat | ✓ Native | ✓ Always | ✓ Yes |
| Elastic APM | ~$8K-$15K (cloud) | Deployment-based | ✓ Partial | ✓ If self-hosted | ✓ Yes |
| Grafana Cloud | ~$15K-$20K+ | Usage-based | ✓ Native | ✓ If self-hosted | ✓ Yes |
| New Relic | ~$20K-$25K+ | Ingest + per-user | Partial | ✗ SaaS only | ✗ No |
| Dynatrace | ~$20K-$35K+ | GiB-hour + commit | Partial | ✓ Managed option | ✓ Managed |
| Datadog | ~$30K-$45K+ | Host + feature-based | Partial* | ✗ SaaS only | ✗ No |
| Splunk | ~$35K-$60K+ | Host + enterprise | Partial | Limited | Limited |
* OTel metrics in Datadog are often billed as custom metrics. All estimates use the methodology assumptions above. Vendor discounts and EDP commitments can significantly reduce SaaS costs.
How to Choose
Choose CubeAPM if cost predictability, data residency, or open standards migration is a priority. At ~$5,100/month vs $30K+ for enterprise SaaS, the savings are structural – not a promotional discount.
Choose Datadog if you need the widest integration coverage and your team has the budget and willingness to manage billing complexity. Model your custom metrics costs before committing.
Choose Dynatrace if automated root cause analysis is the primary need and you’re in a large enterprise. Davis AI is genuinely differentiated. Be prepared for the annual commitment.
Choose New Relic if you’re a smaller team that wants a broad platform and values the free tier to get started without upfront commitment.
Choose Grafana Cloud if you’re OTel-first, want zero proprietary lock-in, and are comfortable either managing self-hosted infra or paying the managed rate.
Choose Elastic APM if your team already runs ELK and wants to add tracing without a new vendor. Incremental cost can be near zero.
Choose Splunk if your organization already has a Splunk investment and needs unified IT and security observability under one contract.
Final Thoughts
The APM market in 2026 has matured past the point where any single vendor is the obvious default. The incumbents earn their position through ecosystem depth, AI maturity, and enterprise support – and for the right teams, those advantages are real.
But the trade-offs have changed. The gap between the most expensive and least expensive option at the same data volume is now 12x – large enough that defaulting to a vendor without running the numbers is hard to justify. For teams with data residency requirements, the SaaS-only constraint of some vendors is a genuine architectural limitation. And for teams building OTel-first infrastructure, paying a custom metrics premium for adopting an open standard is a trade-off worth questioning.
The best approach is to shortlist two or three tools that match your constraints, run a proof-of-concept at realistic data volumes, and model the 12-month TCO before committing. The feature matrices will look similar; the bills won’t.
Keywords: APM tools compared 2026, APM buyer’s guide, application performance monitoring comparison, observability platform evaluation, Datadog alternative, APM pricing comparison, OpenTelemetry APM, CubeAPM