Research, epidemiology, and health sciences in general cannot be carried out without an understanding of data, on which meaningful conclusions can be drawn. Raw data is used to make decisions and biostatistics plays a big role in this process and hence it is important to ensure that professionals identify and categorize various types of data appropriately. The erroneous classification of data may result in the use of incorrect statistical tests, biased explanation, and incorrect conclusions. This paper examines the various data types involved in the biostatistical analysis, their classification, measurement scales and their application in practice.
Basic Statistics of Data in Biostatistics
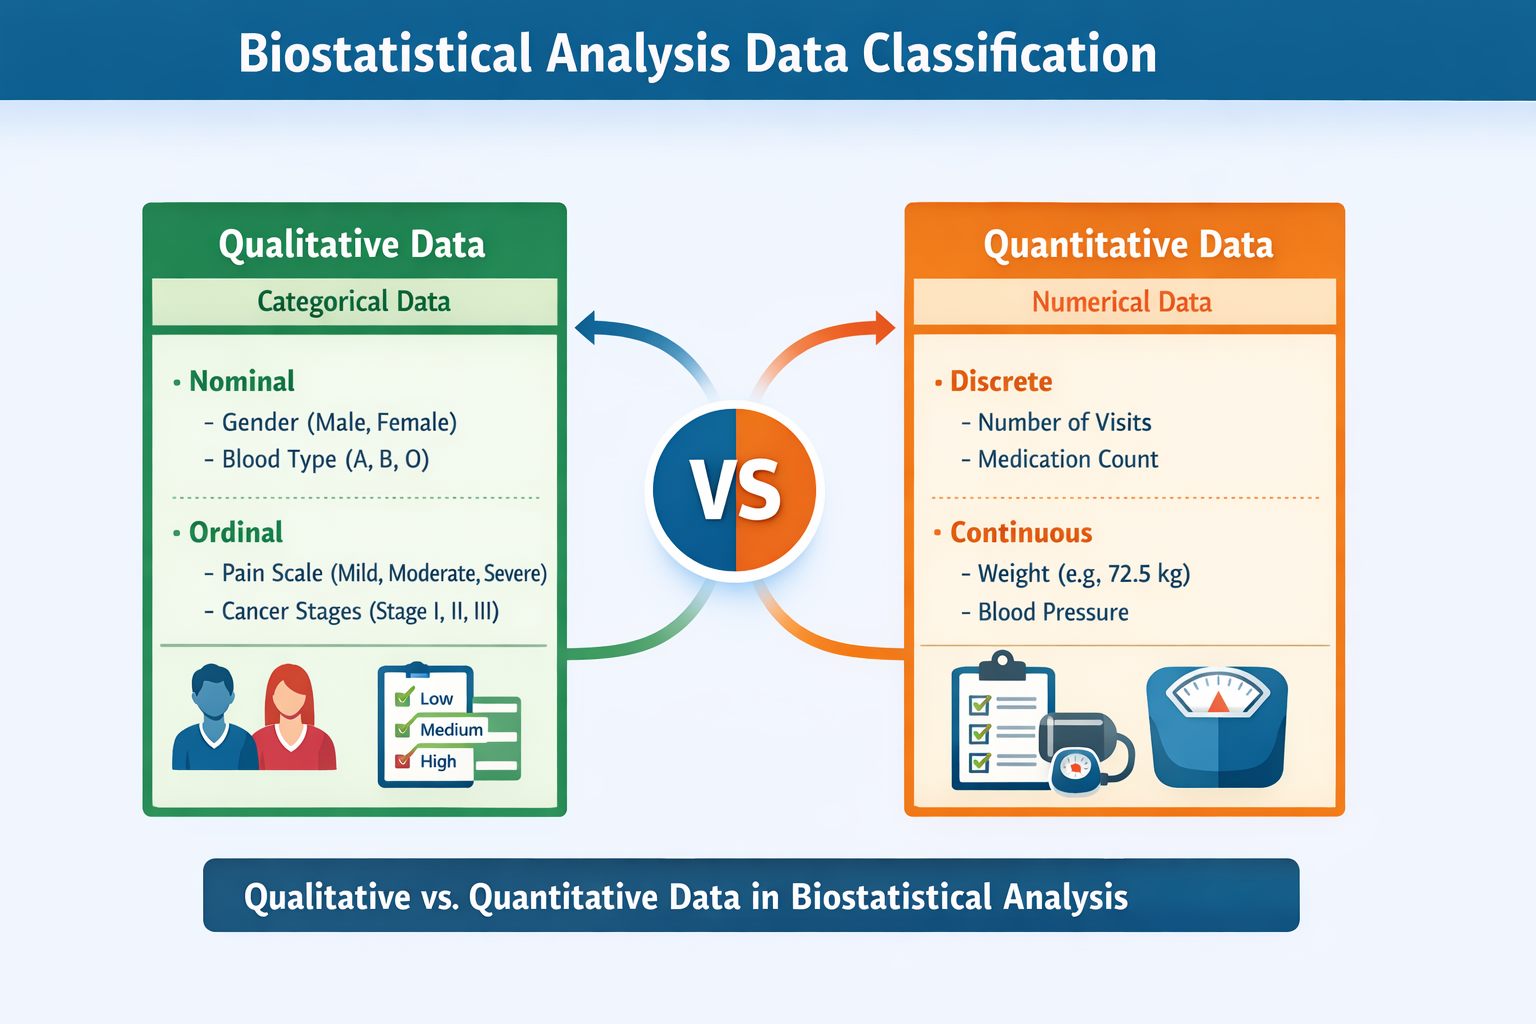
Biostatistics data entails observations or measurements made in the course of research. These observations may be in numerical, categorical or descriptive forms and they are the necessary ones in detecting patterns, testing hypotheses and bearing evidence based conclusions. Generally, biostatistics data can be categorized into qualitative (also known as categorical) and quantitative (also known as numerical) data.
Proper data classification is not only academic but it determines the choice of statistical methods. To take an example, the decision between t-test or the chi-square test rests on the type of variable, i.e. continuous/categorical. That is why the first step to proper biostatistical analysis is to understand what type of data you are dealing with. To go into more details, you may consult this resource on biostatistics.
Qualitative vs. Quantitative Data
Qualitative Data
Categorical data also referred to as qualitative data are descriptions of characteristics or attributes that cannot be numerically measured. They are rather categories or groups. Examples would be gender (male/female), blood type (A, B, AB, O) or the occurrence or lack of an illness.
Qualitative data may further be divided into:
- Nominal Data: This is where there is no order of categories. That is, eye color (blue, brown, green) or marital status (single, married, divorced). These categories are mutually exclusive and they do not have quantitative value.
- Ordinal Data: This kind of data is the one that is ordered or ranked in a meaningful way, however, the distance between the categories is not even. It can be that of disease severity (mild, moderate, severe) or cancer stages (Stage I, II, III, IV). Ordinal data can be compared but cannot be arithmetically operated such as addition or subtraction.
Quantitative Data
Numerical data or quantitative data is information that is measurable and that can be expressed in terms of numbers. Arithmetic operations like addition and subtraction, multiplication and division are possible using this type of data. Quantitative data are further divided into:
- Discrete Data: Discrete data is characterized by taking discrete or distinct values and is not always being measured. They can be the number of visits to a hospital, number of pregnancies or the number of patients in a ward. The discrete variables will never have intermediate values, they will be whole numbers.
- Continuous Data: Continuous data may have any value that lies within a given range, and is usually measured. Examples are height, weight, blood pressure or cholesterol levels. Continuous variables can be statistically analyzed more advanced, as they have an unlimited number of possible values.
Scales of Measurement
The degree of mathematical operations that can be performed on data depends on the scales of measurement in biostatistics. The proper identification of the scale is of utmost importance as this affects descriptive statistics as well as inferential statistics.
Nominal Scale
Nominal scale is used with qualitative variables which have different categories but no order. Examples can be gender, race or blood type. Nominal data can only undergo statistical operations of frequency counts, percentages, and mode. Some of the commonly used inferential tests are chi-square independence tests.
Ordinal Scale
Ordinal scale is used when one has categorical data that has a meaningful order. They can be pain severity (none, mild, moderate, severe), or Likert scale responses in questionnaires (strongly agree to strongly disagree). Ordinal data are the only ones where the medians and percentiles can be calculated but not the arithmetic means. Ondometric variables should be analyzed with the help of non-parametric tests like Mann-Whitney U test or Kruskal-Wallis test.
Interval Scale
The interval scale is used to indicate numerical data whose intervals between values are equal but it does not have a true zero point. Examples are temperature in Celsius, or IQ scores. Since there is no zero, ratios are meaningless (e.g, 40degC is not twice as hot as 20degC). Interpreted data Interpreted data enable the operations of addition and subtraction, but no multiplication and no division. Usually t-tests and ANOVA are used.
Ratio Scale
The most informative scale of measurement is ratio scale. It incorporates a real zero, which is a lack of the quantity under consideration. Such examples are height, weight, blood pressure, and enzyme levels. Ratio data enable us to conduct all arithmetic operations, as well as interesting ratios (e.g. a patient with weight 60 kg is twice as heavy as a patient with weight 30 kg). Depending on the type of data, parametric tests and non-parametric tests both may be used.
Discrete and Continuous Variables: Major Differences
The discrete and continuous variables have a difference that is worth distinguishing since statistical measures vary depending on such difference:
| Feature | Discrete Variables | Continuous Variables |
| Nature | Countable, finite | Infinite possibilities which are measurable. |
| Examples | Hospital admissions, number of children. | Height, blood glucose, weight |
| Analysis | Frequencies, bar charts, Poisson distribution. | Mean, standard deviation, normal distribution. |
| Statistical Tests | Chi-square, exact test of Fisher. | t-test, ANOVA, regression analysis. |
The knowledge of the discrete or continuous nature of a variable will enforce the selection of the necessary analytical methodology to avoid the risk of errors in biostatistical analysis.
The Data Classification in Statistical Analysis
Categorization of information is not a technicality concern, it directly influences the interpretation of results and the nature of statistical tests to be used. The following are some of the practical implications:
Descriptive Statistics: The descriptive statistics I would choose would be a table of means.:
- Frequencies, percentages and modes of nominal and ordinal data are used to summarize data.
- Means, standard deviations and confidence intervals can be used to describe interval and ratio data.
Inferential Tests: To determine the correct Inferential Tests, the problems and issues will be formulated, and the prescripts will be utilized through the use of Inferential Tests.
- Chi-square or Fisher exact tests are usually required when dealing with nominal data.
- Non-parametric tests are usually ordinary data like the Mann-Whitney U test.
- Parametric tests such as t-tests or ANOVA are used to analyze interval and ratio data when the conditions of normality are fulfilled.
Visualization of Data:
- The best solution to categorical data is bar charts and pie charts.
- Scatter plots, box plots and histograms can be used with numerical data.
Data Transformation and Data Normalization:
- Continuous variables can be transformed (e.g. log transformed) so that test assumptions can be satisfied.
- The fact that ordinal data are misclassified as continuous may result in invalid conclusions in case the wrong parametric tests are made.
Real World examples of Data Classification Bio-statistics
Take the following examples of biomedical research:
Clinical Trials:
- Blood pressure (continuous, ratio) is measured to determine the effectiveness of the treatment. Paired t-tests or repeated-measures ANOVA can be used in case of correct classification.
Epidemiologic Studies:
- Status of the disease (disease or no disease) is nominal. Associations between risk factors and disease occurrence are determined using frequencies and chi-square tests.
Survey Research:
- Answers in a 5 point Likert-scale (strongly agree to strongly disagree) are ordinal. Non parametric tests like Wilcoxon rank sum test can be used to test the difference between groups.
As these illustrations show, the type of data identified will determine the statistical method and the hypotheses made.
Significance of Identification of Data
In biostatistics, identification of the data must be done properly due to a number of reasons:
- Validity of Results: The use of inappropriate statistical techniques can give false results. An example of this is that when one uses a t-test on ordinal data he/she might overgeneralize or may not see actual trends.
- Reproducibility: This is achieved through accurate data classification and thus can be replicated to ascertain results by other researchers.
- Communication and Interpretation: The well-defined types of data enable the researchers, clinicians, and policymakers to interpret the data correctly and make informed decisions.
- Ethical Research Practices: Interpretation of data can be misused: This situation may result in incorrect recommendations to the population that can prove harmful or wasteful.
Sophisticated Reflections in Biostatistical Data
In addition to the simple types, there can also be complexities of biostatistical data:
- Mixed Data Type: There are data which have a mixture of nominal, ordinal, and continuous data. Mixed types can be supported using multivariate methods of analysis, such as logistic regression.
- Repeated Measures and Longitudinal Data: Long-term data needs a special approach, which can be a repeated-measures ANOVA or a mixed-effects model.
- Transformations and Scaling: Continuous data can be processed to be normalized or standardized to satisfy the assumptions of the model, which can influence analysis and interpretation.
This is because knowing these high-level nuances will make researchers be able to manoeuvre the complicated datasets without compromising the quality of their research.
Conclusion
Categorization of the information is not only a preliminary process in biostatistical analysis, but the cornerstone of quality research. The proper identification of the qualitative and quantitative data, discrete and continuous variables and the scale of measurement that is suitable will guarantee that statistical tests are used properly and the results are meaningful. Improperly categorized data will affect the validity of the research, inaccurately influence clinical practice, and cause erroneous policies in health.
With the ability to understand data types and their uses, health sciences, epidemiology and clinical research researchers and students can be assured to use data correctly, make the correct conclusion and make their contributions to the evidence-based practice. The rules presented in this paper can be used to navigate in the sea of biostatistical data to eventually facilitate the improved scientific investigation and patient outcomes.