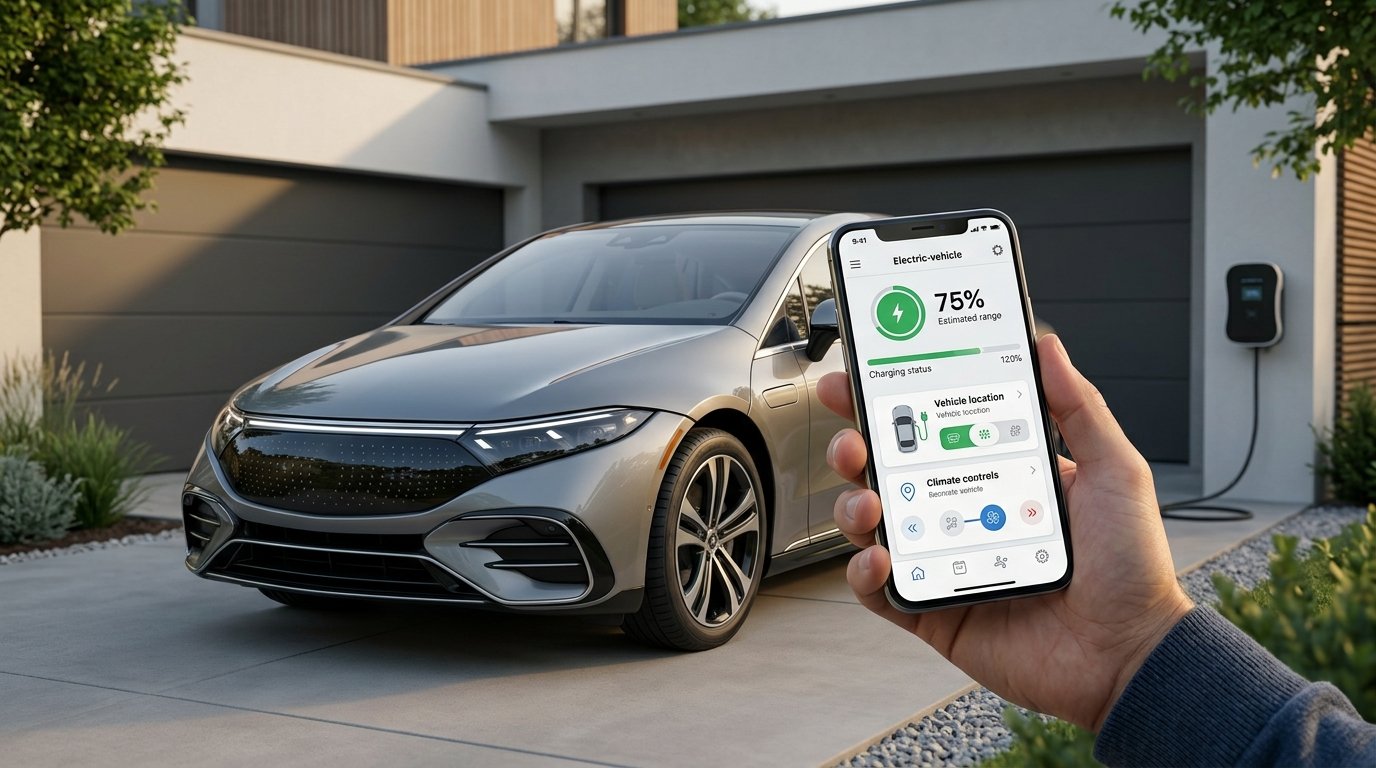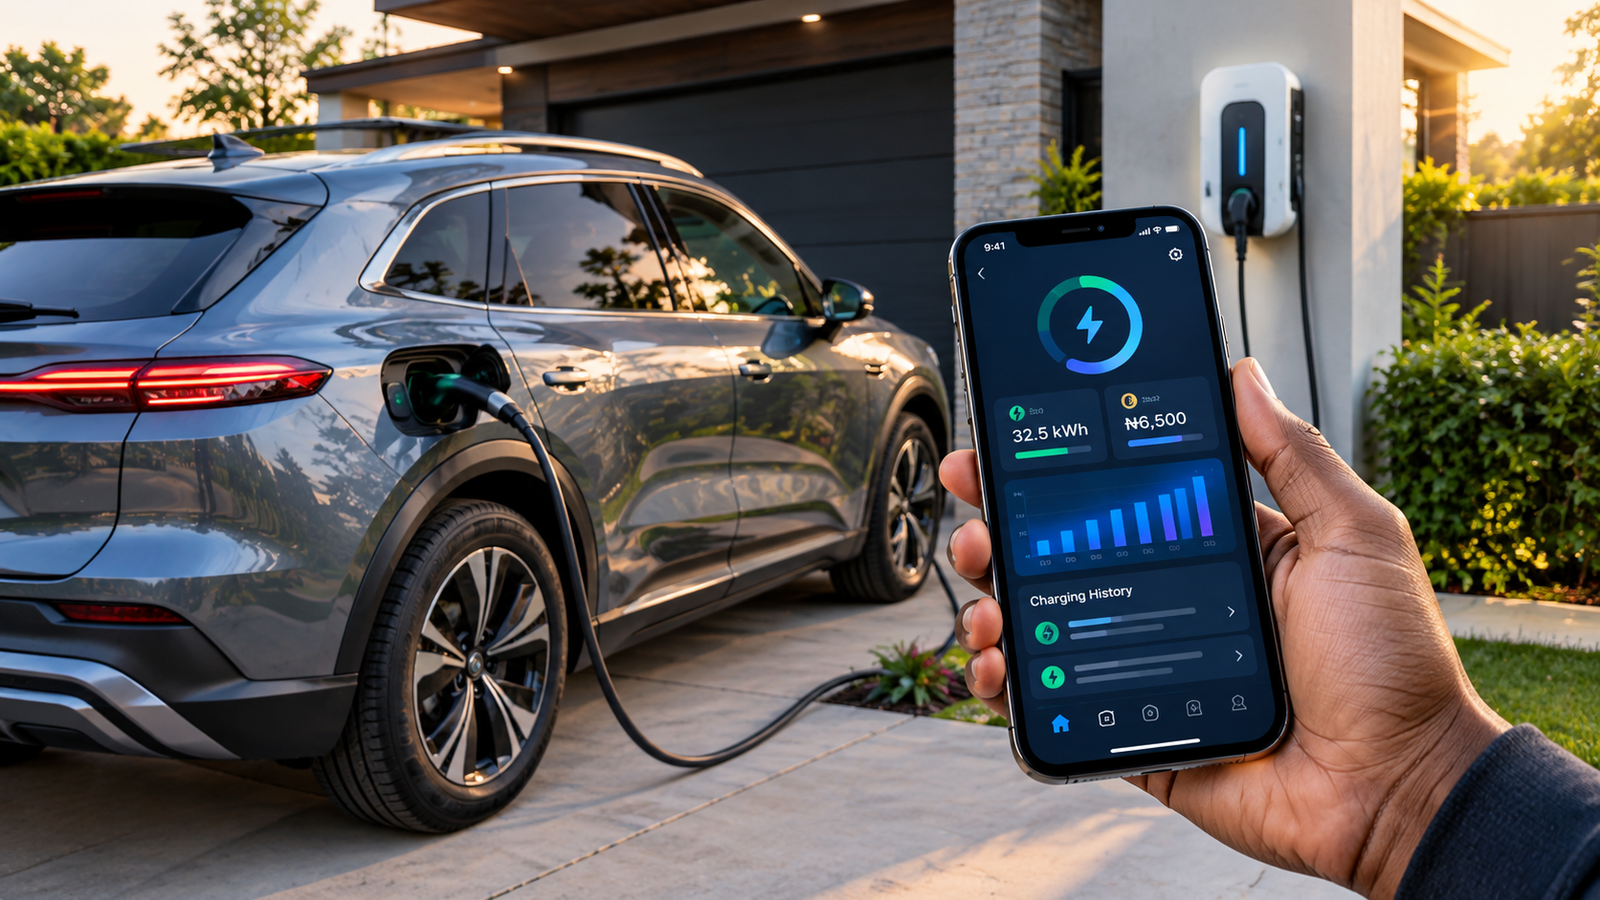
Electric cars have transformed what we think of as normal operating costs. Instead of tracking gallons of petrol or diesel, we are now looking at battery health, electricity use, charge cycles, range, and efficiency. Also, we have electric car apps that make this info easier to present — they log trips, distance traveled, charge events, energy use, and also put out cost estimates.
Over time, what you see is the emergence of trends. A driver may note that motorway travel uses more energy than city driving, or that in cold weather, at high speeds, with heavy loads, and when the air conditioning is on, performance drops off. Looking at many trips as a set gives you a better picture of how an EV performs in the real world, which in turn is better than what you get from a single trip or the vehicle’s estimated range.
What Can Electric Car Apps Track?
EV monitoring apps report on a variety of info, which may vary by vehicle and application. We see that they track things like distance traveled, trip details, battery performance, charge cycles, energy use, travel time, and predicted operating costs. Also, some apps note in detail about certain routes, which in turn makes it easy to compare the same trips.
Mileage logs are also very useful in tandem with charge reports. While we may know the total distance the car has gone, what we also get is the amount of power it took to go that distance. Over time, this will point out which trips use the most energy and also which are the most efficient, which in turn will present a better real-world picture of performance.
Tracking Kilowatt-Hour Consumption
Electric cars report their energy use in kilowatt-hours, which we also see as kWh per 100 km or a similar term measure. What we see is that kilowatt-hour consumption is a way for drivers to compare the amount of electricity used for different trips. Also, a lower number in terms of consumption means the car is using less energy for the same distance traveled.
Over many trips that we track, we see variation in drive range. As energy consumption goes up, the car will generally go for a shorter distance on the same amount of charge. We have apps which help drivers out to see if this variation is due to speed, weather, traffic, road type, or some other factor. Understanding fuel-efficient cars and driving efficiency can provide additional context: top 10 fuel-efficient cars for eco-conscious drivers.
Comparing Different Journeys
The Effect of Speed
Speed does in fact play a large role in EV energy use, which is the cause of increased aerodynamic resistance as a car goes faster. Thus, it is that a motorway trip may use more energy per km than a slower run through the city. Also, we see via tracking apps that drivers’ personal conditions of use do in fact play a role in efficiency.
However, speed is a factor of many. Hills, traffic, acceleration, wind, road surfaces, and driving style play a role in consumption. To really see trends over a series of trips is better than to think that one issue is the cause of every change.
Temperature and Weather
Temperature also plays a role in EV efficiency. In cold weather, the car may use more energy for cabin heat and battery temperature management. In hot weather, we see more electricity usage out of the vehicle for air con and other cooling, which also impacts efficiency.
Recording trips throughout the year helps drivers to notice seasonal variations. If, on the same routes, the car uses more electricity in very hot or very cold weather, the past data is a great resource to determine what causes the change in vehicle range or performance.
Using Travel Diaries to Analyze Energy Use
Trip logs which report over time different types of journeys. Regular commutes, shopping excursions, short local trips, and long-distance drives may have very different energy use. An app which keeps a record of distance and fuel use can make those differences very apparent.
Two which travel the same distance may use different levels of fuel. For instance, one route may have hills, traffic, many stop-and-go sections, or high-speed stretches, while the other may be mostly flat and easy. Also, from past trips, we see which roads and what traffic conditions play a role in fuel efficiency.
Tracking Charging Records
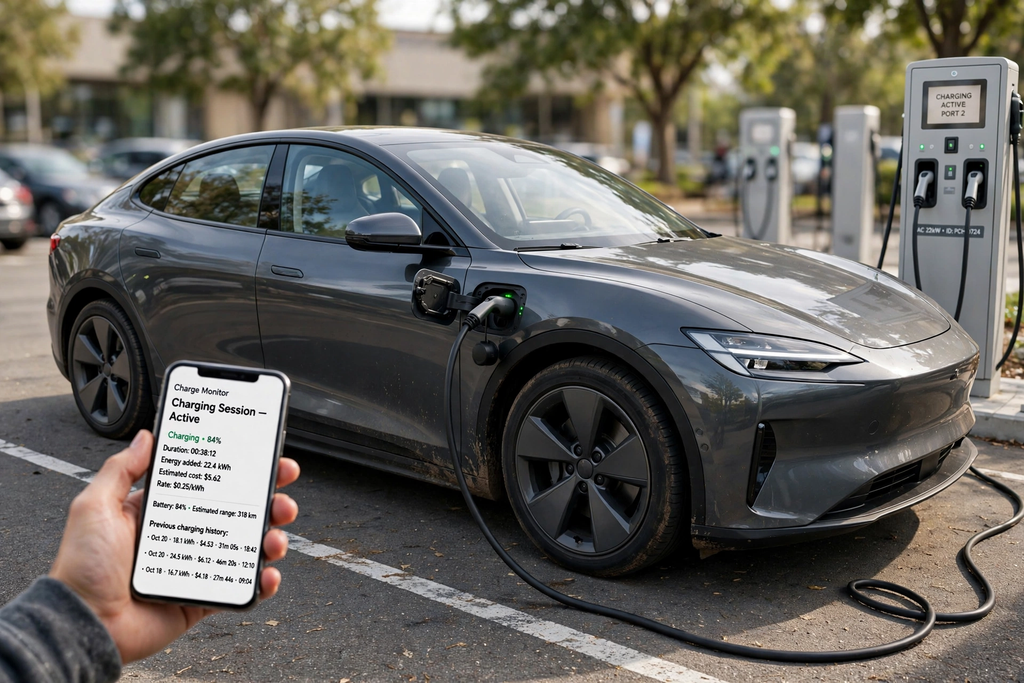
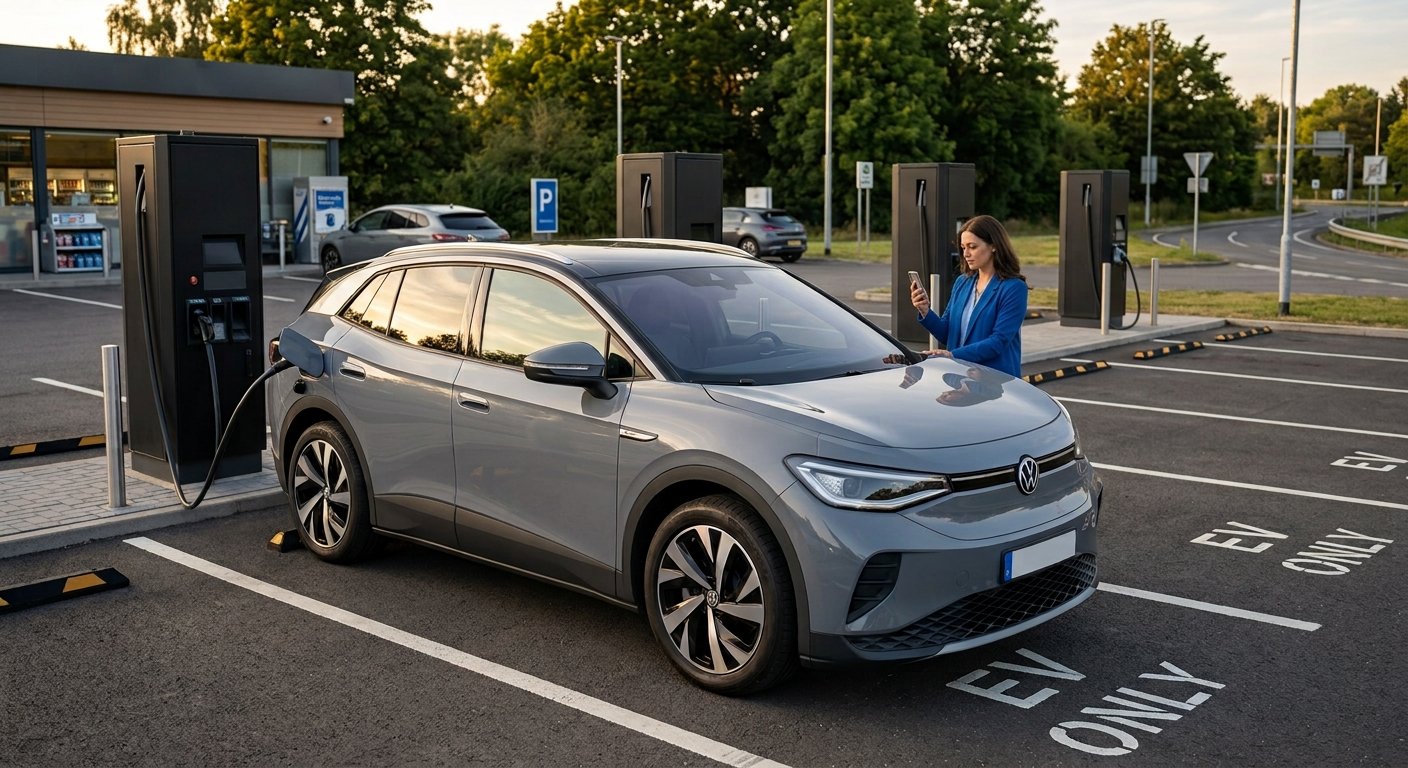
Charging logs also play a role in the history of an EV’s operation. In some apps, users may enter in charging dates, locations, energy added, charge time, and costs. Organizing this info may show how often the car requires charging. You can learn more about how much to charge an EV at a charging station here: how much to charge an EV at a charging station in Bangladesh.
Separating out private and public charging may also be a good idea, which is true because electricity prices do fluctuate a great deal. Over the time which the cars are charged in and out of home and public outlets, charging logs add up, which in turn shows what amount of power the car uses, which in turn shows what is spent on charges. Also, when put together with info on distance traveled, this gives a better picture of total EV operating costs.
Estimating EV Operating Costs
Energy use is a base from which we may determine the cost of electric vehicle operation. If you know your car’s average electricity consumption and the price per kilowatt-hour which you pay, you may calculate the cost of your trips.
Publicly available charging is a factor which complicates this issue, as charging providers may have a variety of price structures. Some may base charge on electricity supplied, while also some may include extra fees or time-based charges. By keeping track of charging records, drivers are able to see these costs, which in turn they can compare with their total mileage.
Understanding Vehicle Load
The energy which an EV uses is a function of the weight it is required to carry. Passengers, luggage, equipment, and any extra items in the car will increase the fuel requirement of the vehicle, especially during acceleration and on hills. Accessory items mounted on the roof also play a role in reducing the car’s aerodynamic efficiency.
An app may not always determine precisely what extra energy was put out by vehicle load, but it can still draw out useful comparisons. For example, a driver may see higher fuel use on a fully loaded holiday trip as against that of normal commute. Also, when we look at load in conjunction with speed, weather, and route conditions, we see a better picture.
Features of an EV App to Look For
Automatic Trip Recording
Automatic trip tracking can make an app a more convenient option, as drivers do not have to report each journey themselves. As per the application, info may be collected from the car, phone, or a different source. With consistent records, long-term comparison becomes much easier.
A practical app will also present historical info in an easy-to-use way. As a driver, you may want to compare distance, energy use, and trip time between different days or routes. We collect this data not just for the sake of it but to make your day-to-day driving easier.
Charging and Energy Tracking
Charging up and energy tracking is what it’s all about as far as connecting the dots between what you drive and how much electricity you use. See which times you charged and what the energy total was to better understand your charging routines and total electricity use.
When we include trip info with the charging data, what we see is the average distance traveled by drivers between charge cycles. Also, this feature may point out changes due to higher mileages, weather, or that of various driving conditions.
Why Long-Term Tracking Matters
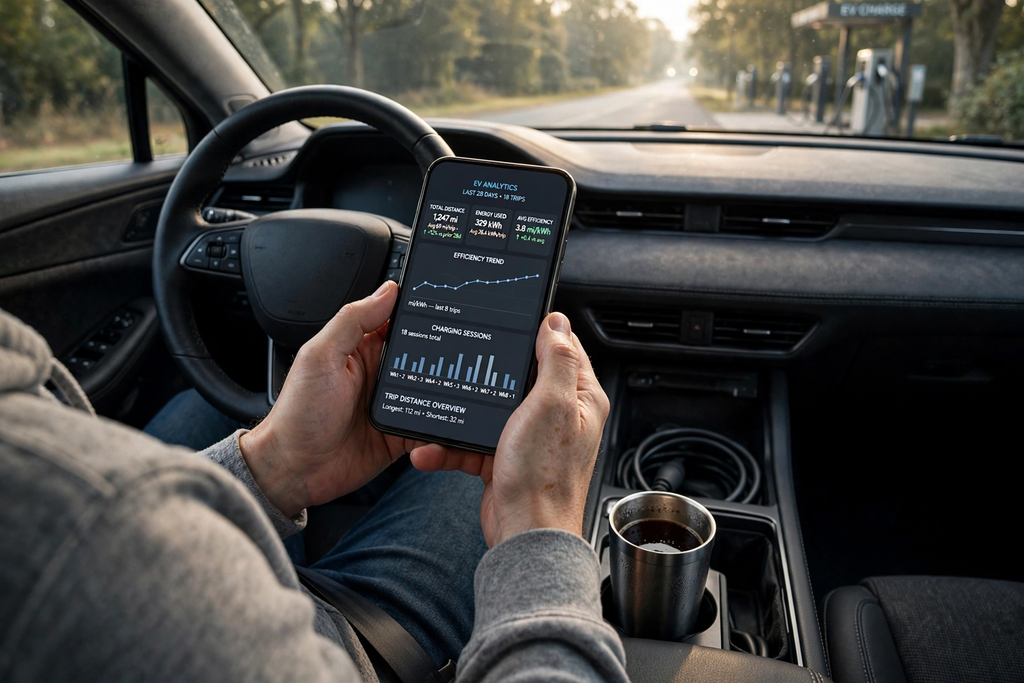
A single data point doesn’t tell the full story. For example, a trip may see out-of-the-ordinary traffic, extreme weather, heavy luggage, or a very steep route. With long-term tracking, we put that in perspective and also are able to tell the difference between what is normal variation and what is a consistent issue.
Regularly, we see which cars’ performance in terms of distance traveled, energy use, charge cycle, and also what the costs are, that gives EV drivers a better picture of what their cars are doing. It is not true that drivers have to go into great detail after every trip. What we find is that by looking at the info at periodic intervals and noting what trends are present is often enough to get value from the data.
Conclusion
Electric vehicle apps which report on how your car uses energy in real-world settings. They track mileage, kilowatt-hour use, charging sessions, trip logs, and operating costs out of what may not be present in the dashboard.
The best strategy is to look at trends over time, which in turn will help you ignore fluctuations in performance. Speed, temperature, traffic, road, and vehicle conditions play a role, which is why you see variation in efficiency from trip to trip. By looking at this info over time, what drivers do is get a better picture of their EV’s energy use and daily operating costs.